AI Management Myths vs Reality
Most "AI strategies" aren't strategies. They're subscriptions.
A tool gets approved, seats get provisioned, a Slack announcement goes out. From that point, the strategy consists of paying the invoice. Nobody can say what adoption looks like, what a query costs, or whether delivery actually improved because of the tool rather than alongside it.
That gap between what leaders believe about their AI rollout and what the data shows is where budgets leak. Here are six of the most common myths, what the reality looks like in session-level data, and what would actually close each gap.
Does switching on an AI tool automatically increase productivity?
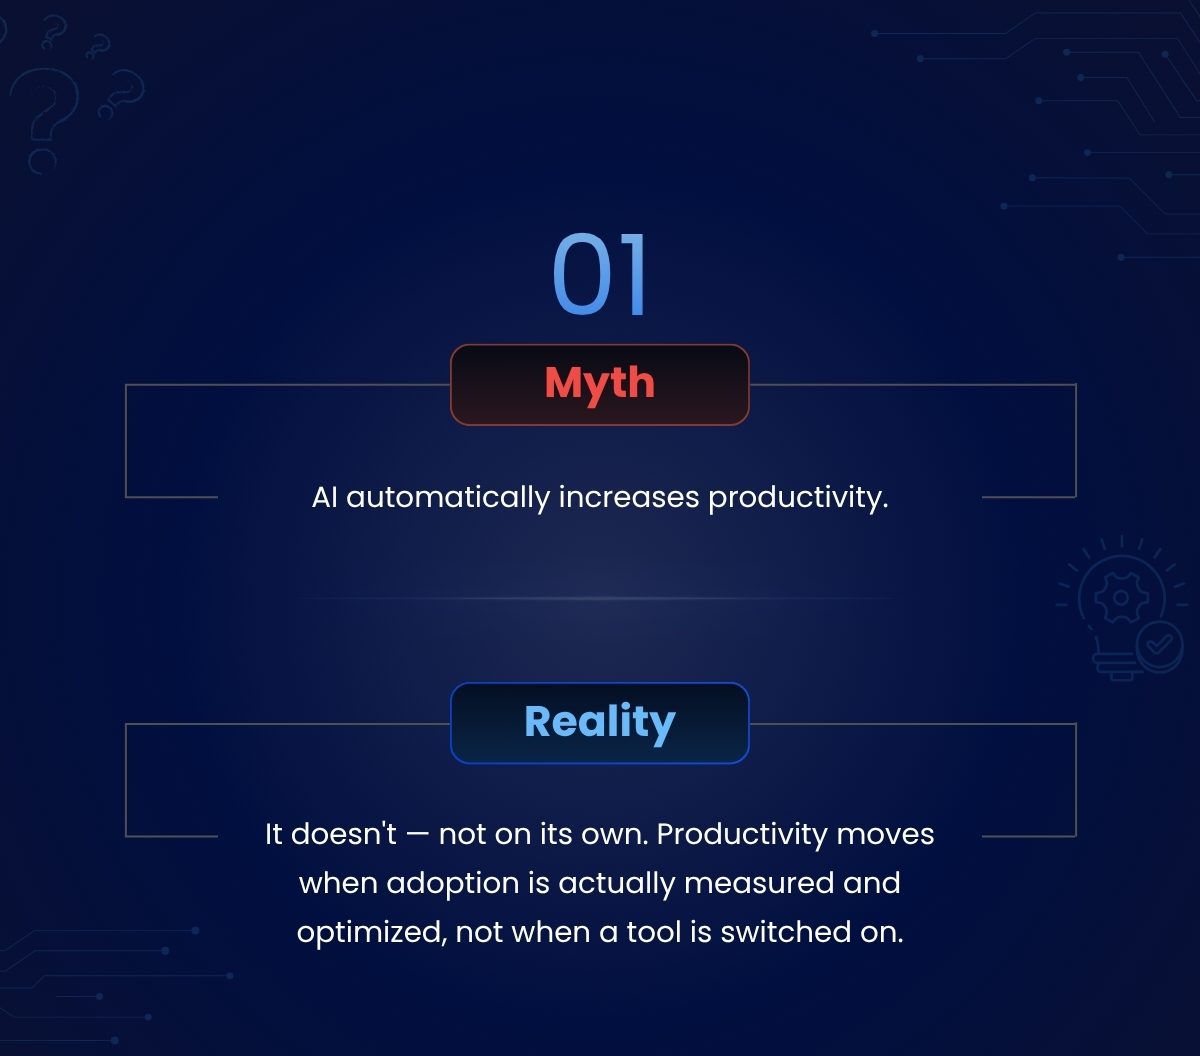
The myth, as it appears in most rollout decks: "AI automatically increases productivity." The reality: "It doesn't, not on its own. Productivity moves when adoption is actually measured and optimized, not when a tool is switched on."
The distribution problem is what the myth hides. In our 30-day session tracking data, adoption split into power users running 35–67 sessions a month, occasional users running under 15, and a long tail of seats logging nothing at all. The top 20% of developers by adoption generated 60–70% of the productivity gain. A team-level average (or worse, an assumption) tells you none of this.
What closes the gap is per-developer adoption data: CloudByte PMS captures every session (prompt, response, tokens in and out) through a lightweight sync agent, so per-developer and per-project adoption percentages are a dashboard read-out rather than a guess. Once you can see who the low-adopters are, targeted onboarding becomes possible, and that is the intervention that actually moves productivity.
Are token costs too small to worry about?
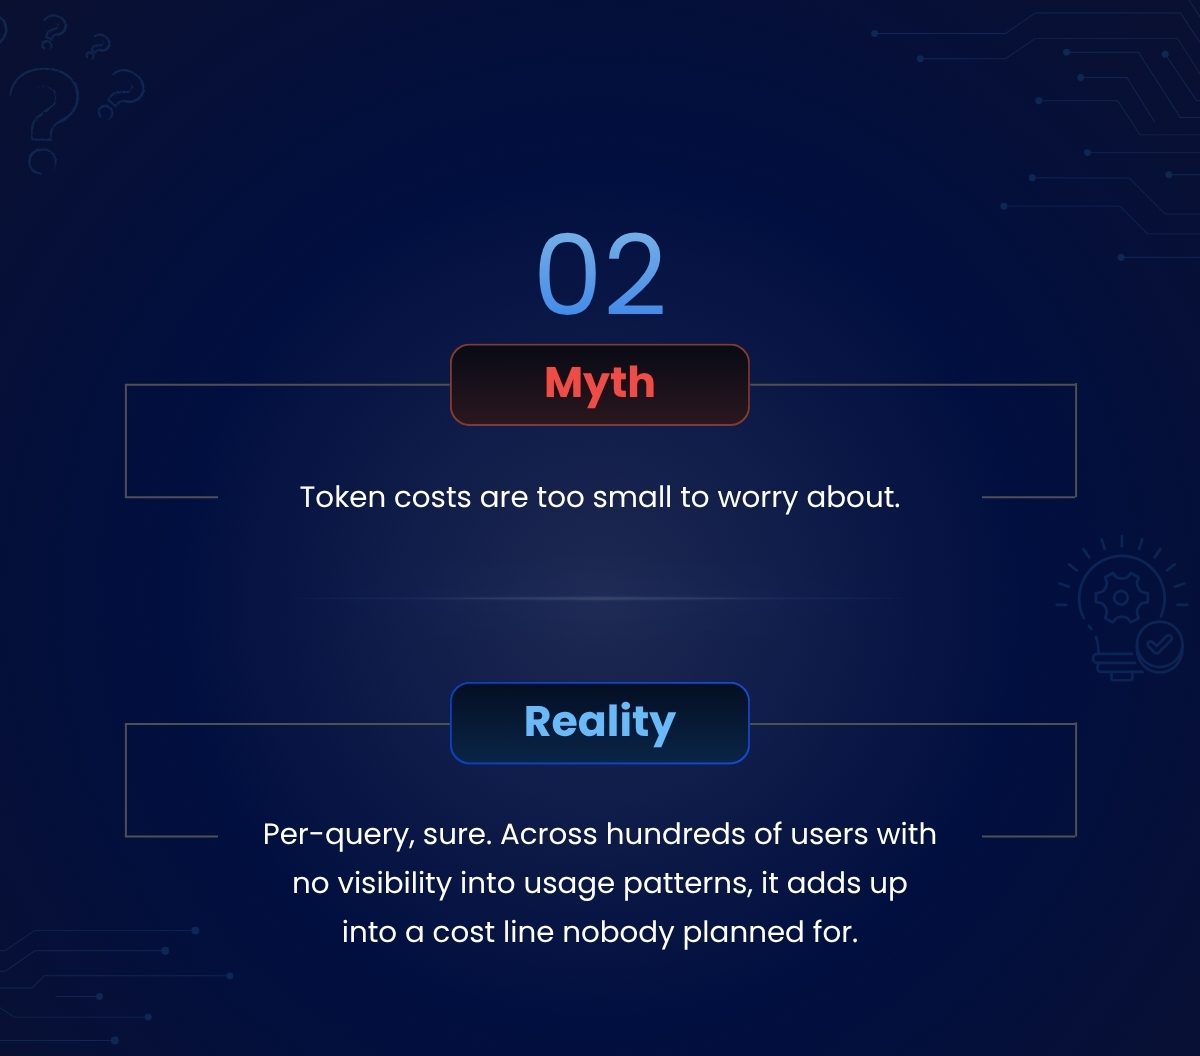
The myth: "Token costs are too small to worry about." The reality: "Per-query, sure. Across hundreds of users with no visibility into usage patterns, it adds up into a cost line nobody planned for."
The arithmetic is easy to underestimate. Agentic Claude Code sessions cost $0.30–$3.50 per merged PR on Sonnet, trivial per PR, but a team merging 200 PRs a month at a $1.20 median is carrying $240/month of API spend that sits entirely outside seat subscriptions, and complex Opus work multiplies it. Finance discovers this line at quarter end; engineering discovers it when finance asks.
The fix is not spending less (the ROI usually justifies the spend). It is knowing the number. CloudByte PMS tracks cost per session, per developer, per project, and per PR, covering all four Anthropic token types, so "what is our cost per query right now" has an answer accurate to the current billing period rather than a shrug.
Do more AI tools mean better outcomes?
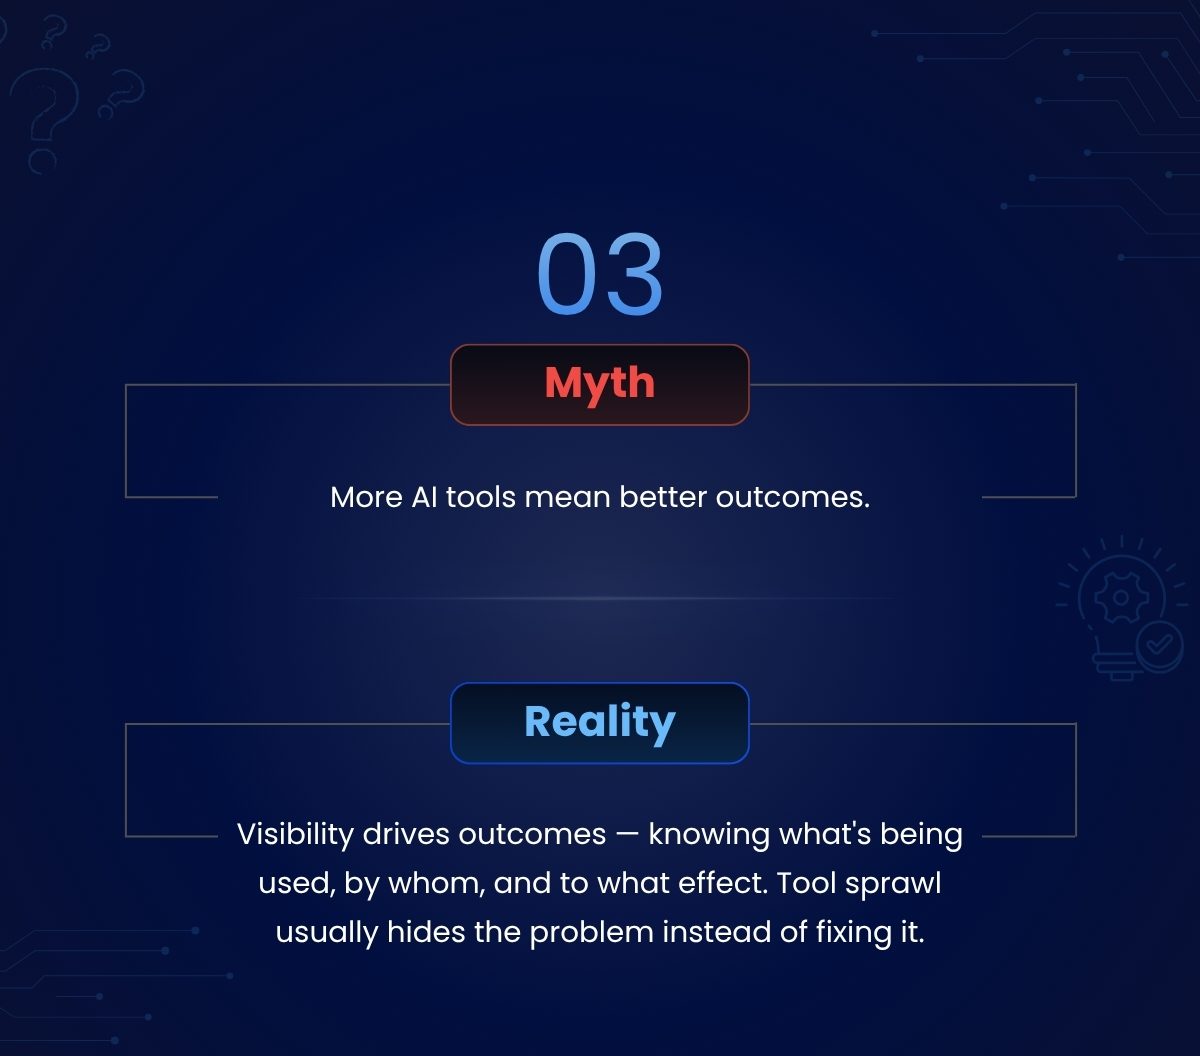
The myth: "More AI tools mean better outcomes." The reality: "Visibility drives outcomes: knowing what's being used, by whom, and to what effect. Tool sprawl usually hides the problem instead of fixing it."
The sprawl pattern is familiar: Copilot underwhelms, so Cursor gets trialled, then Claude Code, and within two quarters the team is paying for three overlapping subscriptions with no data on any of them. Each new tool resets the adoption clock and fragments whatever usage signal existed. The underlying question (is anyone getting value from what we already have?) never gets answered, because no single tool's admin panel can answer it.
An analytics layer that spans tools is what breaks the cycle. CloudByte PMS surfaces Claude Code, GitHub Copilot, and Cursor activity in one dashboard, which is what lets engineering managers compare tools on actual usage and output before deciding whether the answer is another subscription or better onboarding for the current one.
Is every seat you're paying for actually being used?
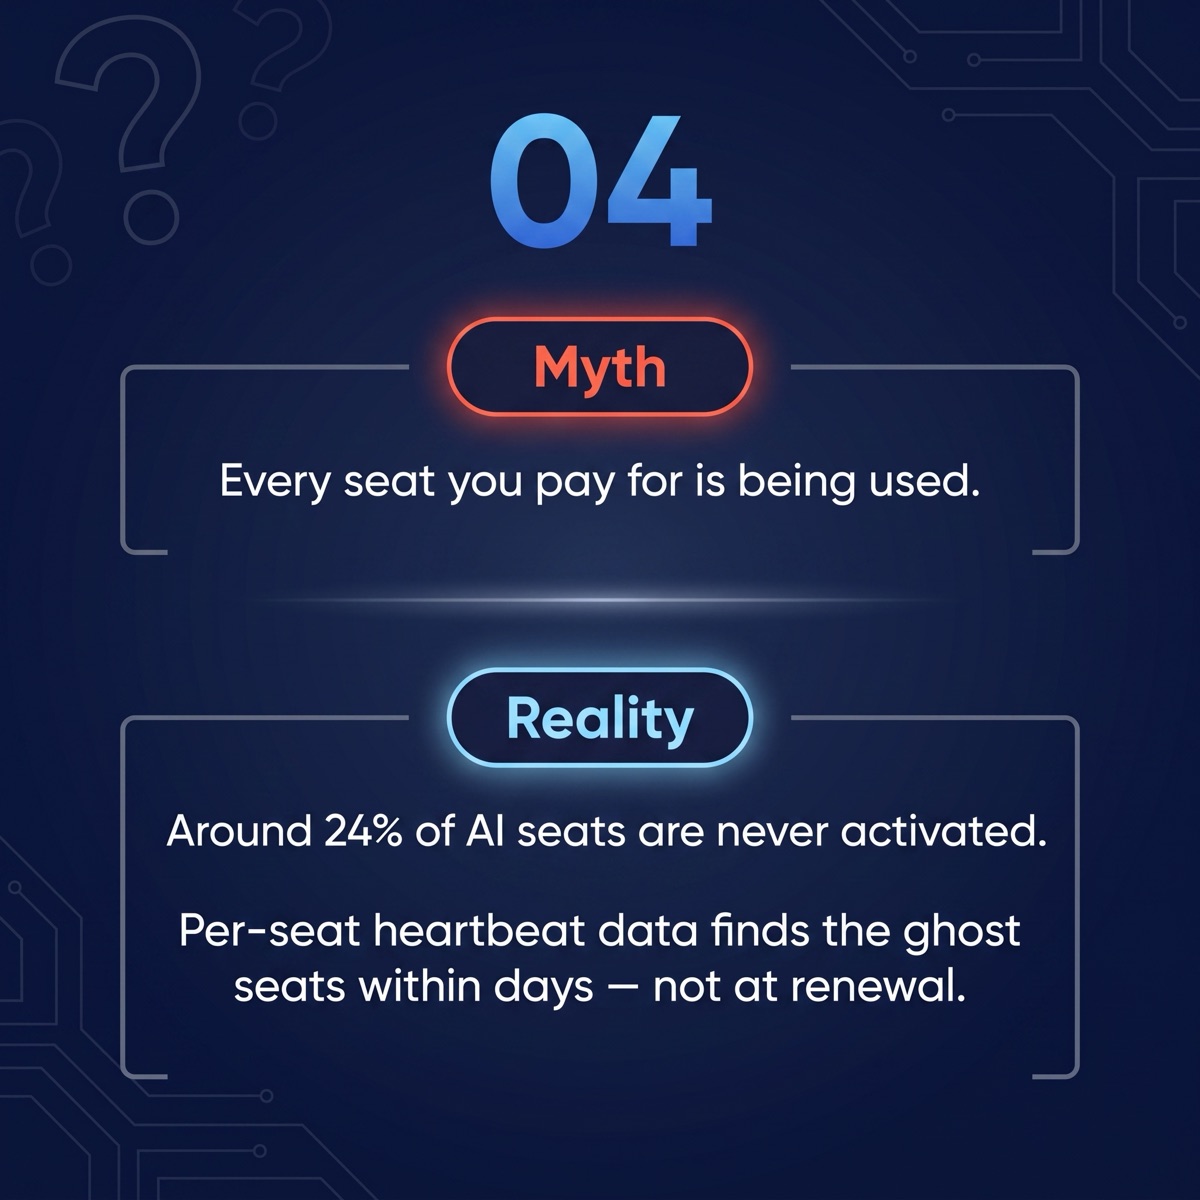
The myth: paying for a seat means someone is using it. The reality: in our own renewal audit, 7 of 29 Claude Code seats had never logged a single session: not low usage, zero usage. Provisioned, credentialed, dormant, and auto-renewing. Vendors will not flag this for you; unused seats are your problem, not theirs.
Ghost seats are the fastest payback item in any AI budget review, because the remediation is a conversation, not a project. Roughly 40% of ghost seats are stalled setups that a 30-minute pairing session converts into active users; the rest are seats to revoke or reallocate.
CloudByte PMS detects them automatically: a machine heartbeat per developer seat means any account in "provisioned, zero sessions" status is flagged on the dashboard within days, not discovered at renewal, twelve billing cycles too late.
Can developer surveys tell you how much time AI saves?
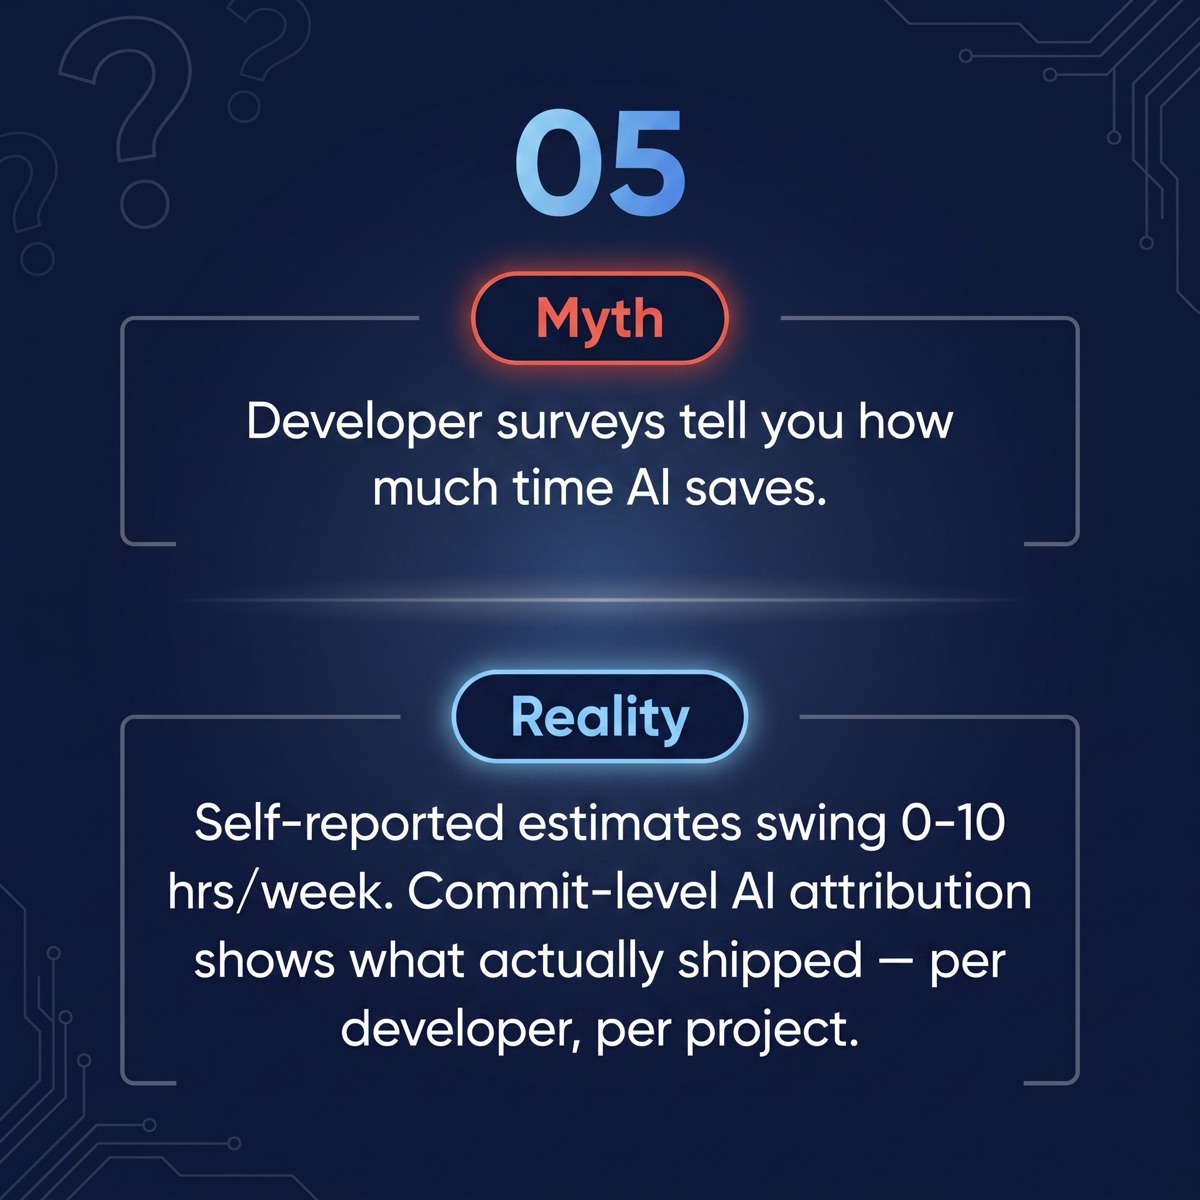
The myth: asking developers "how much time does AI save you?" produces a usable number. The reality: survey responses on this question routinely range from zero to ten hours a week within the same team, and the honest answer for most respondents is a guess. Recency bias, enthusiasm, and tool loyalty all contaminate the estimate, in both directions.
Surveys are still useful as a sentiment check. But when the number feeds a renewal decision or a board slide, it needs to survive the question "how do you know?", and a defensible ROI calculation requires measured inputs: active developer counts, session depth, and output actually attributed to AI assistance.
That attribution is the specific capability surveys cannot replicate. CloudByte PMS ties every commit to whether it was AI-assisted, at the individual developer and project level, so the time-savings estimate is grounded in what shipped rather than what people remember shipping.
Do improving DORA metrics prove the AI investment is working?
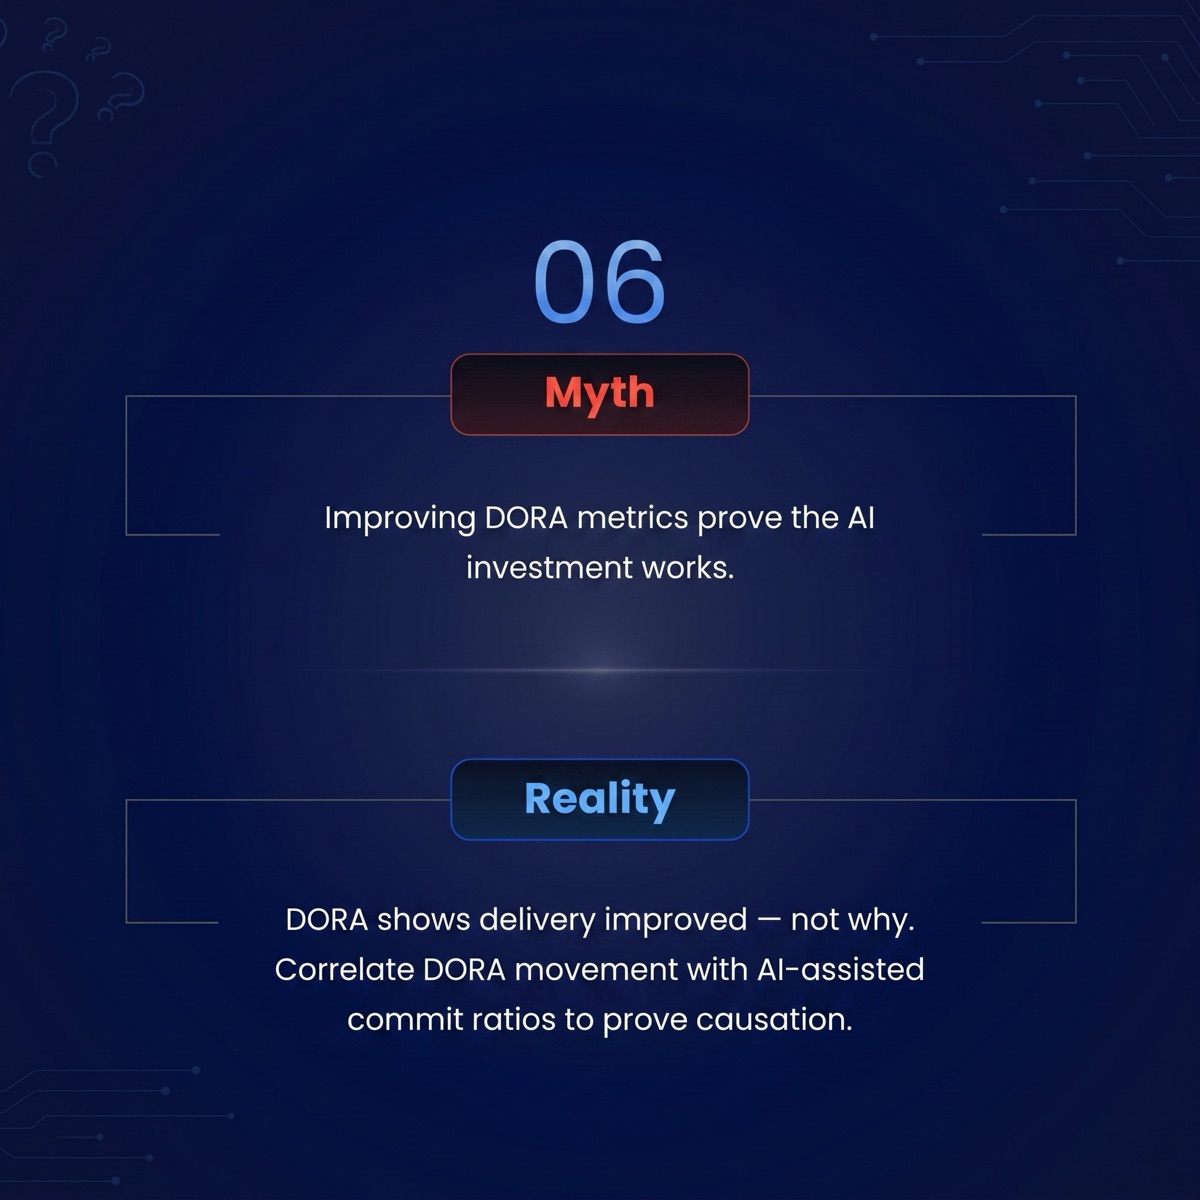
The myth: deploy frequency rose after the AI rollout, therefore the AI rollout worked. The reality: correlation over a quarter proves very little. A new CI pipeline, a re-org, a quieter release cycle, or one strong hire produces the same chart. DORA metrics answer "are we shipping faster"; they cannot answer "is AI why".
Attribution requires holding the team constant and splitting the commits: compare lead time on AI-assisted versus non-AI-assisted commits for the same developers over the same period. If the improvement concentrates where AI activity is high, you have evidence. If it is uniform, look at your process changes instead.
Because CloudByte PMS records both sides (AI session activity and git output, per developer), it can correlate DORA movement against AI-assisted commit ratios directly. That is the difference between reporting an improvement and defending a causal claim at budget time.
Where visibility closes the gap
Each myth survives because the question underneath it has no data source. This is what the same questions look like with and without a telemetry layer:
| Question | Without visibility | With CloudByte PMS |
|---|---|---|
| Who is actually using AI, and how deeply? | Anecdote and Slack sentiment | Per-developer adoption %, session depth, per-project split |
| What does a query, a session, a PR cost? | Discovered at invoice time | Cost tracked per session, per developer, per PR: all four Anthropic token types |
| Which seats are dormant? | Found at renewal, if ever | Ghost seats flagged within days via per-seat heartbeat |
| How much time is AI really saving? | Survey guesses, 0–10 hrs/week variance | Commit-level AI attribution per developer and project |
| Did AI cause the delivery improvement? | Correlation and hope | DORA movement correlated against AI-assisted commit ratios |
| Which projects benefit most from AI? | Unknown | Per-project adoption and output attribution |
| Is our AI data leaving our control? | Depends on each vendor | BYOK Anthropic keys, self-host or air-gap deployment, RBAC + SSO |
None of this requires a heavyweight platform rollout. The sync agent is lightweight, and the dashboard is org-scoped with role-based access from day one.
What should you do before adding another AI tool?
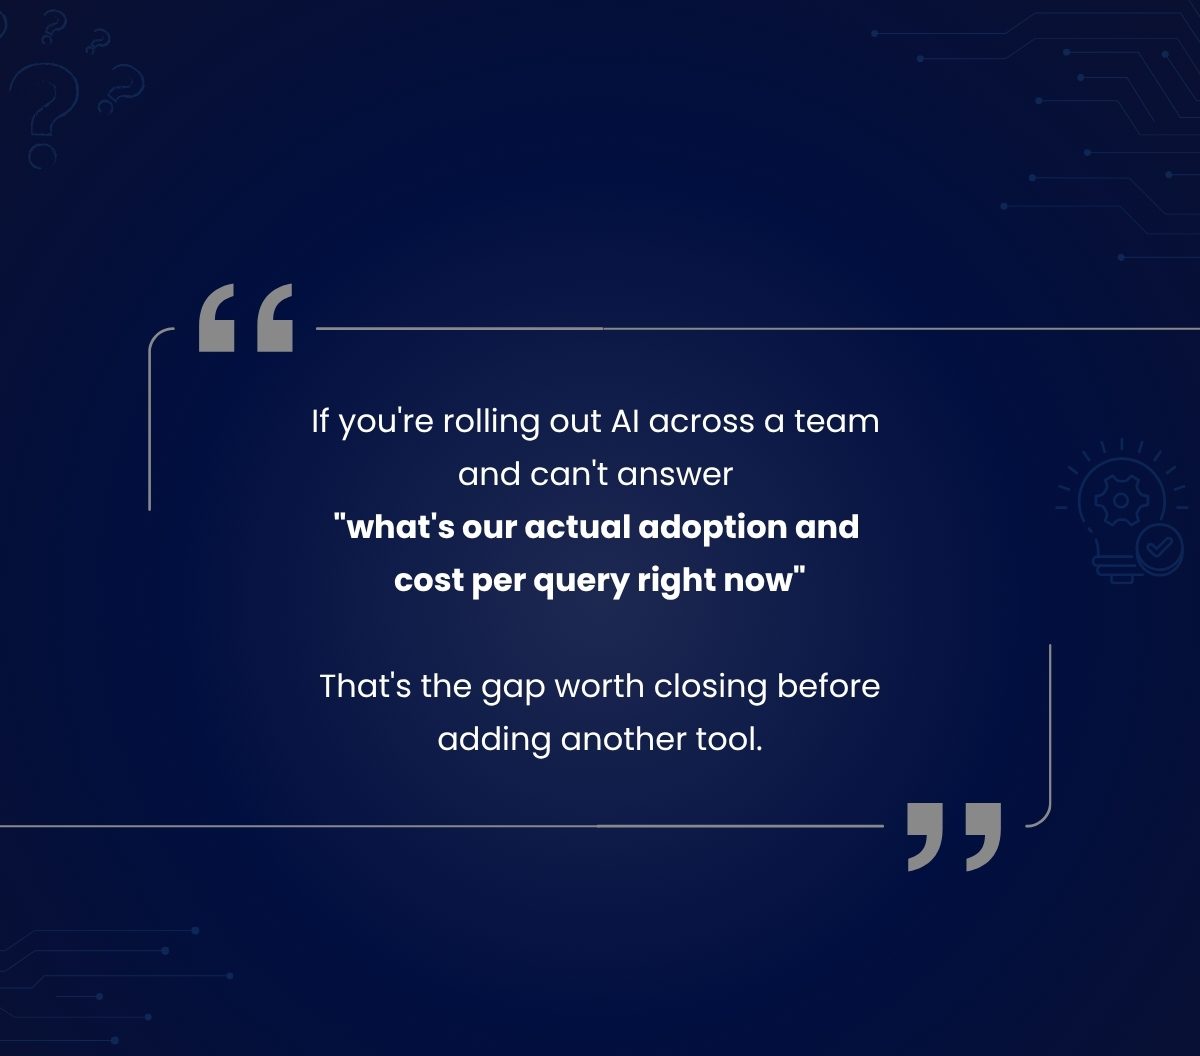
The line from the carousel this post started as holds up: "If you're rolling out AI across a team and can't answer 'what's our actual adoption and cost per query right now,' that's the gap worth closing before adding another tool."
For a team of 10–200 developers, that gap is closable in days, not quarters. CloudByte PMS is free for up to 5 developers, and the first billing cycle of session data is usually enough to find the ghost seats, the cost concentration, and the adoption distribution hiding under the team average.
If you want to see what that visibility looks like against your own stack (Claude Code, Copilot, Cursor, or all three), book an AI readiness discovery call. We'll walk through the questions above and show you which ones your current setup can and cannot answer.
FAQ: AI management myths
Does an AI tool rollout automatically increase productivity?
No. Productivity moves when adoption is measured and optimised. The top 20% of developers by adoption typically generate 60–70% of the gain, and roughly a quarter of seats log zero sessions: a distribution invisible without per-developer session data.
Are token costs really worth tracking?
Yes. Individually small, they compound: agentic Claude Code sessions run $0.30–$3.50 per merged PR, and at 200 PRs a month that is a genuine budget line outside seat subscriptions. Tracking cost per session, developer, and PR turns it from a surprise into a managed number.
Does adding more AI tools improve outcomes?
No. Visibility does. Tool sprawl multiplies spend and fragments usage data, hiding the adoption problem it was meant to solve. Measure the current tool's adoption and output before adding another.
How common are ghost seats?
About 24% of seats in a typical bulk rollout are never activated. A per-seat heartbeat surfaces them within days of provisioning instead of at renewal.
Why aren't developer surveys enough to measure AI time savings?
Self-reported estimates vary from zero to ten hours a week within one team and cannot be attributed to projects or tasks. Commit-level AI attribution measures what actually shipped with AI assistance.
Can DORA metrics alone prove AI ROI?
No. They show delivery improved, not why. Comparing AI-assisted against non-AI-assisted commits for the same developers over the same period is what isolates the AI contribution.