How AI Coding Tools Change Your DORA Metrics (And What They Can't Tell You)
Most engineering teams roll out AI coding tools and then check their DORA metrics three months later hoping to see improvement. Some do improve. Most improvement is real but unattributed: the dashboard shows better lead time, but there is no way to tell whether Claude Code drove it or whether the new CI pipeline did.
This is the gap between DORA metrics and AI activity tracking. Both matter. They answer different questions.
Do AI coding tools actually improve DORA metrics?
Yes. Teams using AI coding tools typically see deploy frequency rise 18–35% and lead time for changes fall 20–30% within the first 90 days, driven primarily by acceleration in the code-change-to-PR phase.
The mechanism is straightforward: drafting the change, iterating on edge cases, and writing tests account for 40–60% of lead time in most teams. AI tools accelerate exactly this phase. When that phase compresses, the whole pipeline moves faster without any change to review, CI, or deploy processes.
The effect is not uniform. Teams with low AI adoption rates, under 30% of commits AI-assisted, see smaller improvements than teams at 60%+. Teams that adopt AI tools but do not track usage cannot tell which developers are contributing to the improvement and which are not.
What the data shows by AI adoption rate
Across engineering teams in the CloudByte PMS dataset with at least 60 days of AI activity tracking alongside delivery metrics:
| AI adoption rate | Deploy freq. change | Lead time change | Change fail rate change |
|---|---|---|---|
| Under 30% of commits AI-assisted | +5–12% | −8–15% | +1–3% (slight increase) |
| 30–60% AI-assisted | +14–22% | −15–22% | Flat to −3% |
| 60%+ AI-assisted | +25–35% | −20–30% | −2–6% |
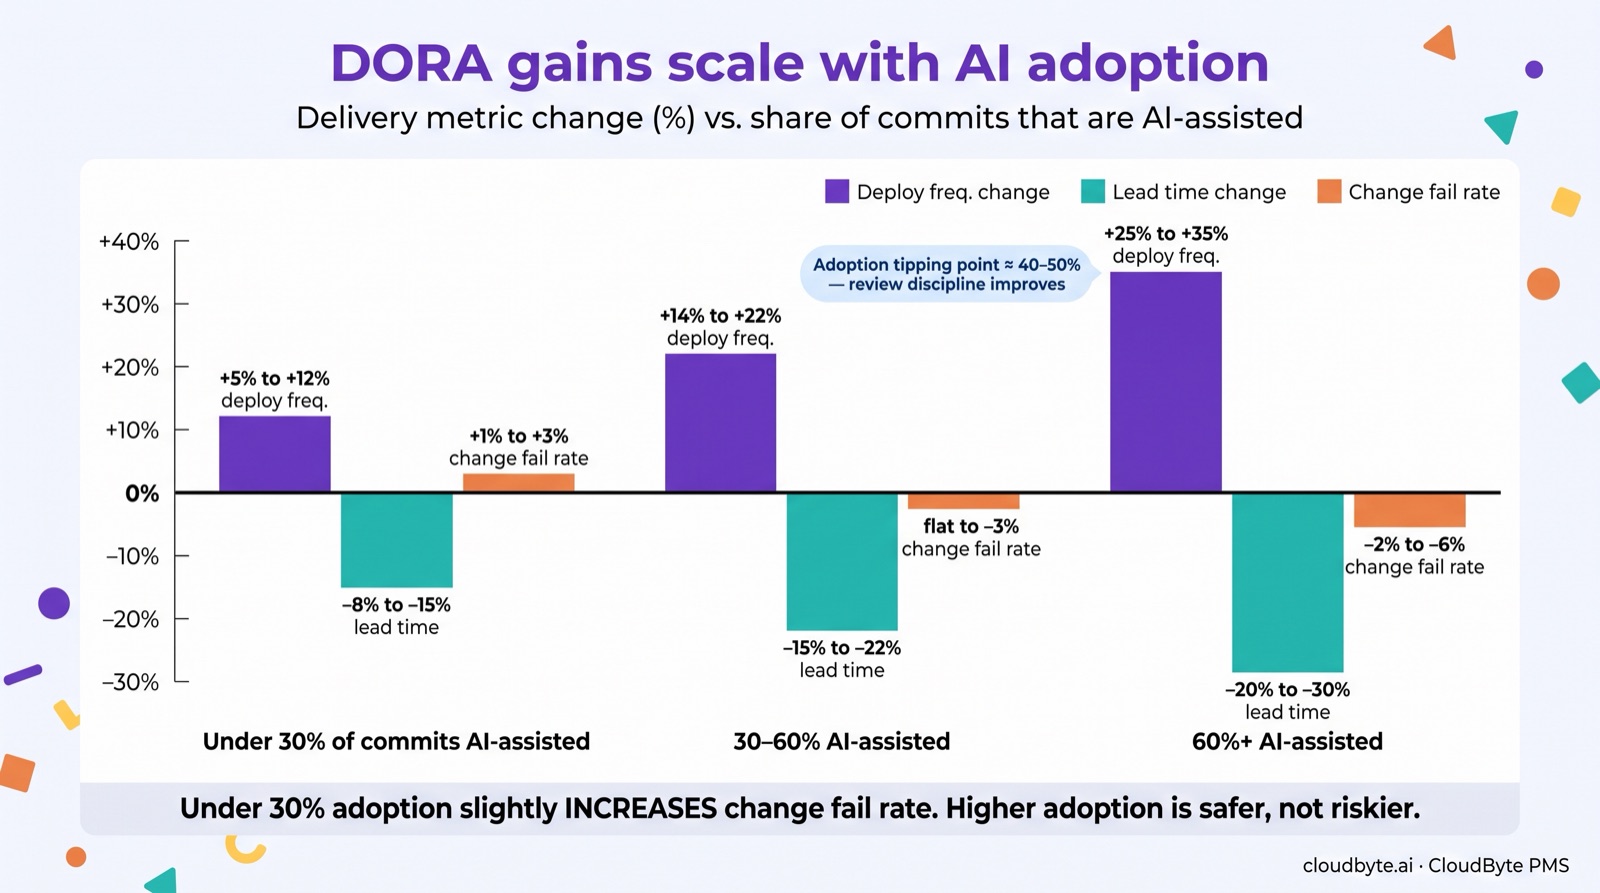
The change fail rate finding surprises most engineering managers: low AI adoption correlates with a slight increase in change fail rate, not a decrease. Developers using AI tools inconsistently tend to review outputs less carefully than they would review hand-written code. The cutover point in our data is around 40–50% AI-assisted commits, where review habits become more disciplined.
Which DORA metrics change most when your team adopts AI coding tools?
Lead time for changes drops first and fastest: a median 22% reduction for AI-assisted commits vs. non-AI-assisted commits from the same developer on the same codebase, based on CloudByte PMS data.
Deploy frequency follows, typically with a 4–8 week lag: as PRs ship faster, batch sizes shrink naturally and teams that were shipping weekly move toward two-per-week or daily cadences.
Change fail rate and MTTR are less directly affected and depend more on review discipline, test coverage, and incident response processes that AI tools do not directly touch.
Which phase of lead time does AI compress most?
Lead time has three components worth tracking separately once your team is using AI tools:
- Code-change phase: developer drafts and iterates on the change. AI tools compress this 25–40%. This is where the biggest gains accumulate.
- Review phase: PR open to approved. AI tools have modest impact here. Smaller PRs move through review faster, but the compression is 5–15%, not 25–40%.
- Deploy phase: approved PR to production. CI/CD and branching strategy drive this, not AI tools. Expect 0–5% change.
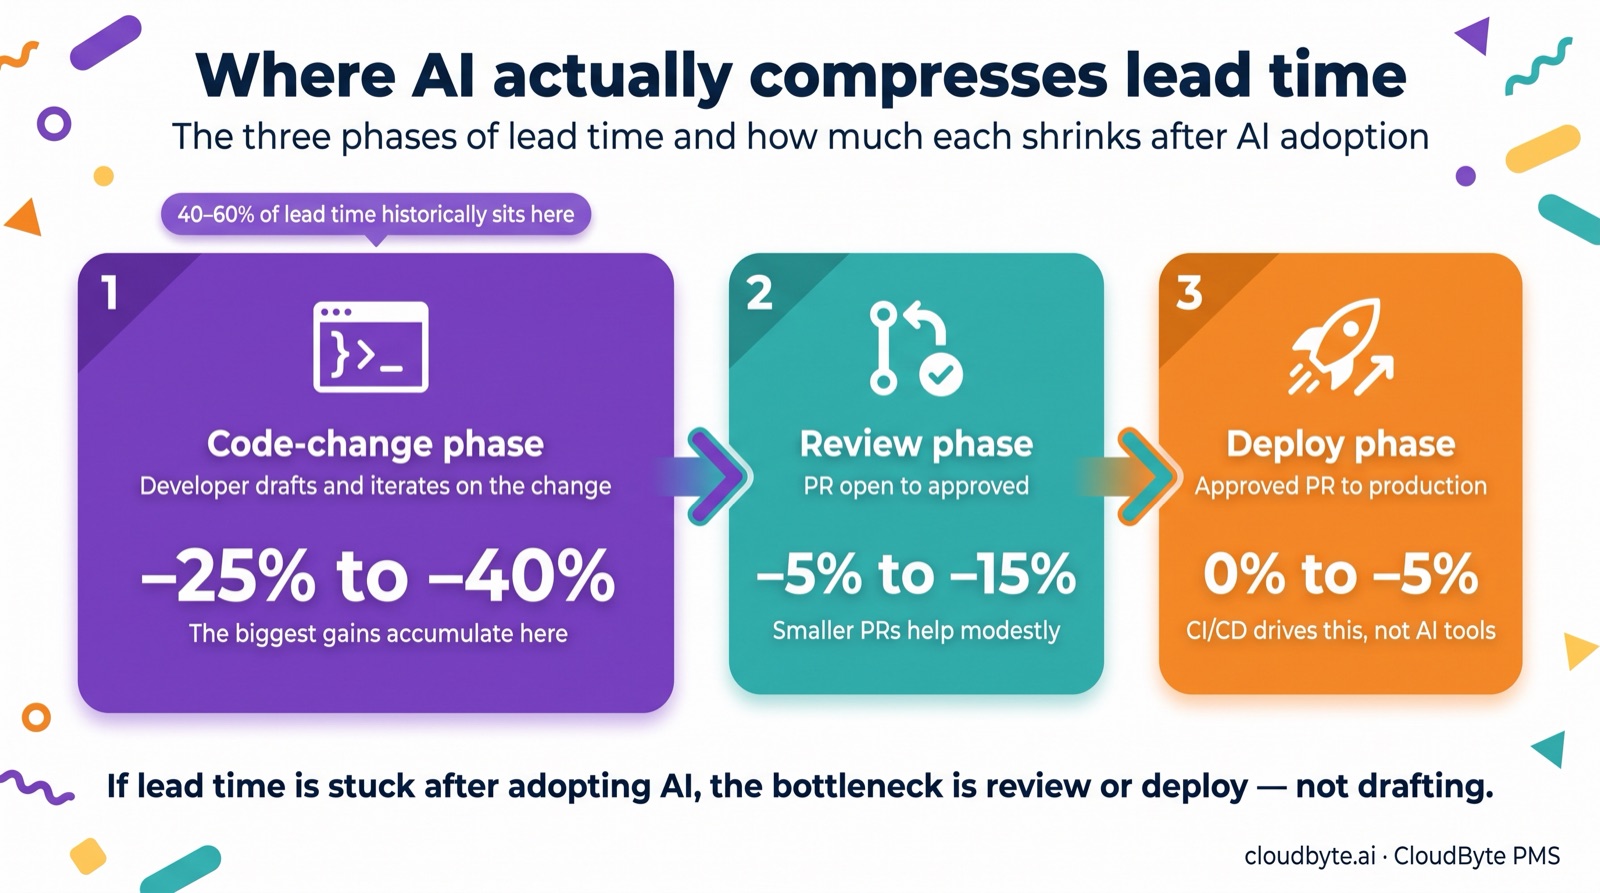
The implication: if your lead time is stuck after adopting AI tools, the bottleneck is review or deploy, not drafting, and more AI tool investment will not fix it.
Why DORA metrics alone can't tell you if AI is working
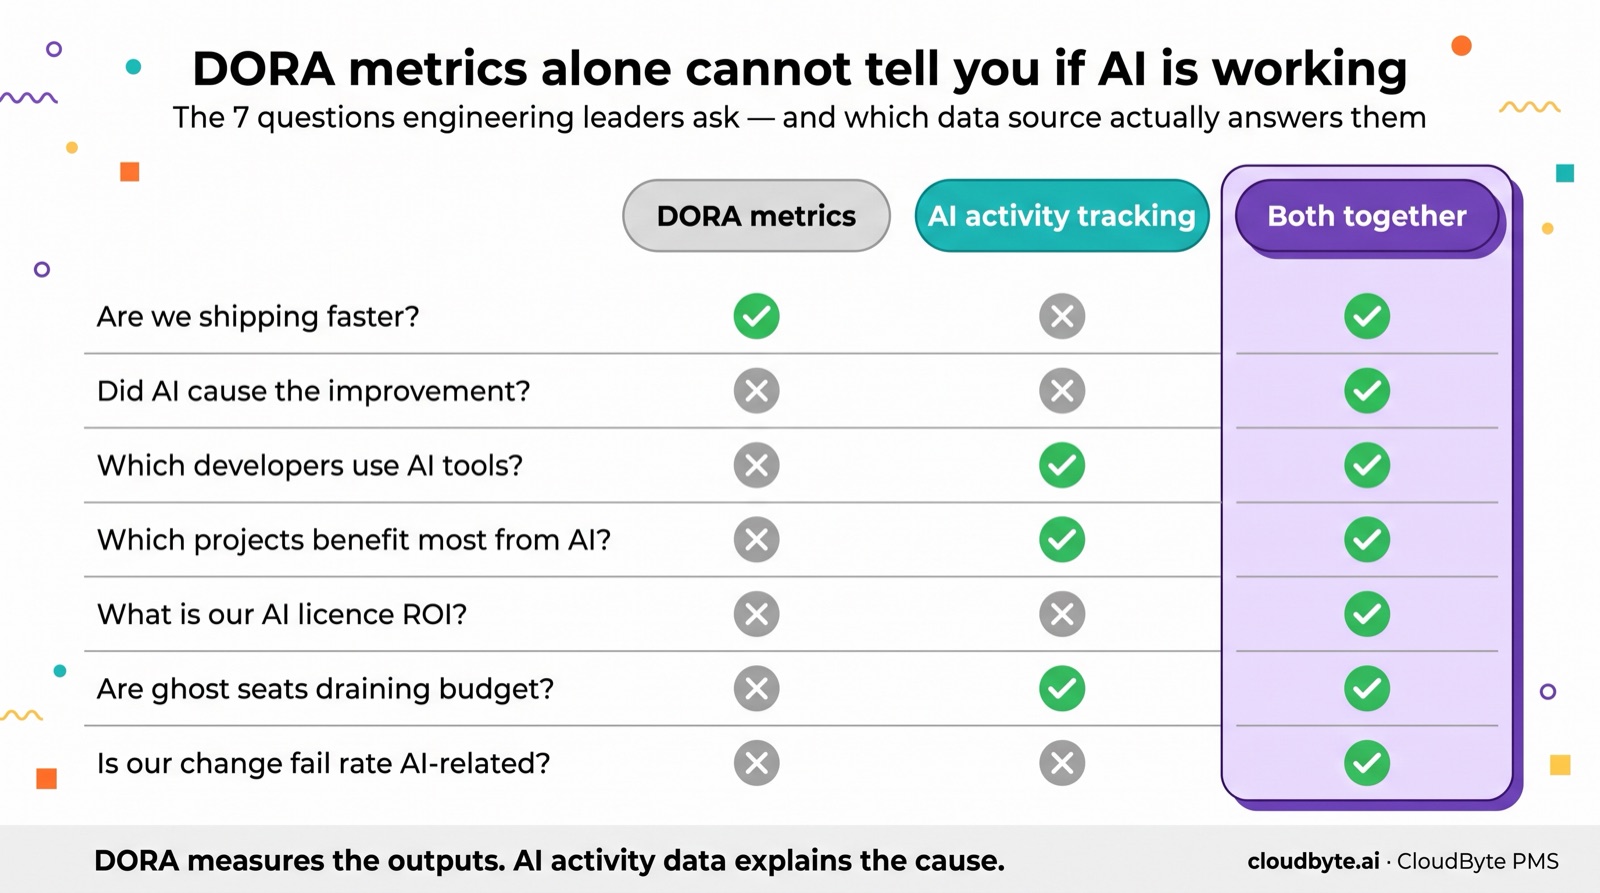
DORA metrics measure delivery outputs; they cannot tell you whether AI tools caused an improvement or which developers are driving it. You need AI activity data mapped alongside delivery metrics to isolate the AI contribution.
This matters at renewal time. Without the AI layer, engineering leaders renew (or cancel) AI tool licences with no causal evidence. A rising DORA score is consistent with AI impact, but it is equally consistent with a new CI/CD pipeline, a team restructure, or a lighter sprint.
| Question | DORA metrics | AI activity tracking | Both together |
|---|---|---|---|
| Are we shipping faster? | ✅ | ❌ | ✅ |
| Did AI cause the improvement? | ❌ | ❌ | ✅ |
| Which developers use AI tools? | ❌ | ✅ | ✅ |
| Which projects benefit most from AI? | ❌ | ✅ | ✅ |
| What is our AI licence ROI? | ❌ | ❌ | ✅ |
| Are ghost seats draining budget? | ❌ | ✅ | ✅ |
| Is our change fail rate AI-related? | ❌ | ❌ | ✅ |
The right-most column ("Both together") is where the real insight lives. It requires mapping per-developer AI session data (session counts, AI-assisted commit ratios) to each developer's DORA output. When that correlation is positive and specific, you have controlled evidence. When it is absent, you have a confounding factor to investigate.
Tracking tip. Compare lead time for AI-assisted vs. non-AI-assisted commits from the same developer in the same 30-day window. The developer, codebase, and time period are held constant, so any difference in lead time is more likely attributable to the AI tool than to external factors.
How do you measure AI's contribution to DORA metric improvements?
The most reliable method is per-developer, per-commit AI attribution: compare lead time for AI-assisted vs. non-AI-assisted commits from the same developers over the same period to produce a controlled estimate of AI impact.
This is different from team-level AI adoption tracking. Team-level data tells you what percentage of commits were AI-assisted. Per-developer attribution tells you whether AI-assisted commits from a given developer are faster than their non-AI-assisted commits, a controlled comparison that holds constant the developer, codebase, and time window.
The practical steps:
- Capture AI session activity at the developer level: sessions per day, AI-assisted commit count, model used.
- Tag commits as AI-assisted or not: commit metadata from the local agent is the source of truth. Without this tag, you cannot split the comparison.
- Run the comparison monthly: AI-assisted lead time vs. non-AI-assisted lead time, per developer and per project.
- Flag outliers: developers with high AI session counts but no improvement in lead time are candidates for coaching on task scoping or CLAUDE.md configuration.
CloudByte PMS tracks this automatically: AI-assisted commit ratios, lead time per commit type, and per-developer AI activity alongside DORA metrics in one dashboard.
What to watch in the first 90 days
The first 90 days of AI tool adoption generate noise in DORA metrics. Developers experiment, not optimise. Lead time may improve one week and regress the next as they find their workflow.
By week 10–12, adoption patterns stabilise and trends become reliable. The signal to watch is not the trend line but the variance: teams with consistent AI adoption (60%+ AI-assisted commits, week over week) show much lower lead time variance than teams still in the experimenting phase. High variance is a sign the team has not found its productive workflow yet, not that AI tools are not working.
FAQ: DORA metrics and AI coding tools
Do AI coding tools improve DORA metrics?
Yes. Teams typically see 18–35% improvements in deploy frequency and 20–30% reductions in lead time for changes within 90 days. The gains are concentrated in the code-change-to-PR phase. Change fail rate and MTTR are less directly affected by AI adoption.
Which DORA metric improves most from AI tools?
Lead time for changes improves most reliably: median 22% shorter for AI-assisted commits vs. non-AI-assisted commits on the same codebase. Deploy frequency follows with a 4–8 week lag. Change fail rate shows mixed results: low adoption slightly increases it, while high adoption (60%+) correlates with a 2–6% reduction.
Can DORA metrics tell you if your AI tool investment is working?
DORA metrics can show delivery is improving but cannot confirm AI caused it. You need AI activity data (per-developer session counts and AI-assisted commit ratios) mapped alongside DORA metrics to isolate the AI contribution from other improvement drivers such as CI/CD changes or team restructuring.
How do you measure AI's contribution to DORA improvements?
Compare AI-assisted vs. non-AI-assisted commit lead time for the same developers in the same period. If AI-assisted commits are consistently faster, that is controlled evidence. If lead time drops uniformly across all commit types, the improvement likely has a different cause. CloudByte PMS tracks AI-assisted commit ratios and lead time per commit type automatically.
What do DORA metrics miss in an AI-assisted engineering team?
Four things: (1) which developers are actually using AI tools vs. holding ghost seats; (2) how AI usage patterns differ between high-output and low-output developers; (3) AI licence ROI per unit of delivered output; and (4) the causal link between AI adoption and delivery improvements. DORA measures the output side; AI activity tracking fills in the input side.
How often should you review DORA metrics alongside AI activity data?
Weekly for anomaly detection, monthly for trend analysis, quarterly for ROI review. A spike in change fail rate alongside a jump in AI session volume warrants immediate investigation. DORA metric trends need 4–6 weeks of data to be statistically meaningful. Quarterly reviews compare AI tool spend against the dollar value of lead time improvement using fully-loaded engineer hourly cost.