How to Roll Out Claude Code to Your Engineering Team: A 30-Day Playbook
Rolling out Claude Code to an engineering team in 30 days requires three things done before day one — licensing, a shared CLAUDE.md, and usage tracking instrumented — followed by a structured four-week expansion from pilot to full team, with ghost seat detection built in from week two.
Most engineering managers skip the pre-work and provision everyone on day one. The result: 35–40% ghost seat rates within 60 days, no visibility into which developers are actually using Claude Code, and renewal decisions made on intuition rather than data.
This playbook covers the setup steps, the week-by-week milestones, and the three metrics that predict whether a rollout will stick.
TL;DR
- Do three things before day one: allocate licences by squad, ship a team CLAUDE.md, and instrument usage tracking. Skipping this causes 35-40% ghost seat rates within 60 days.
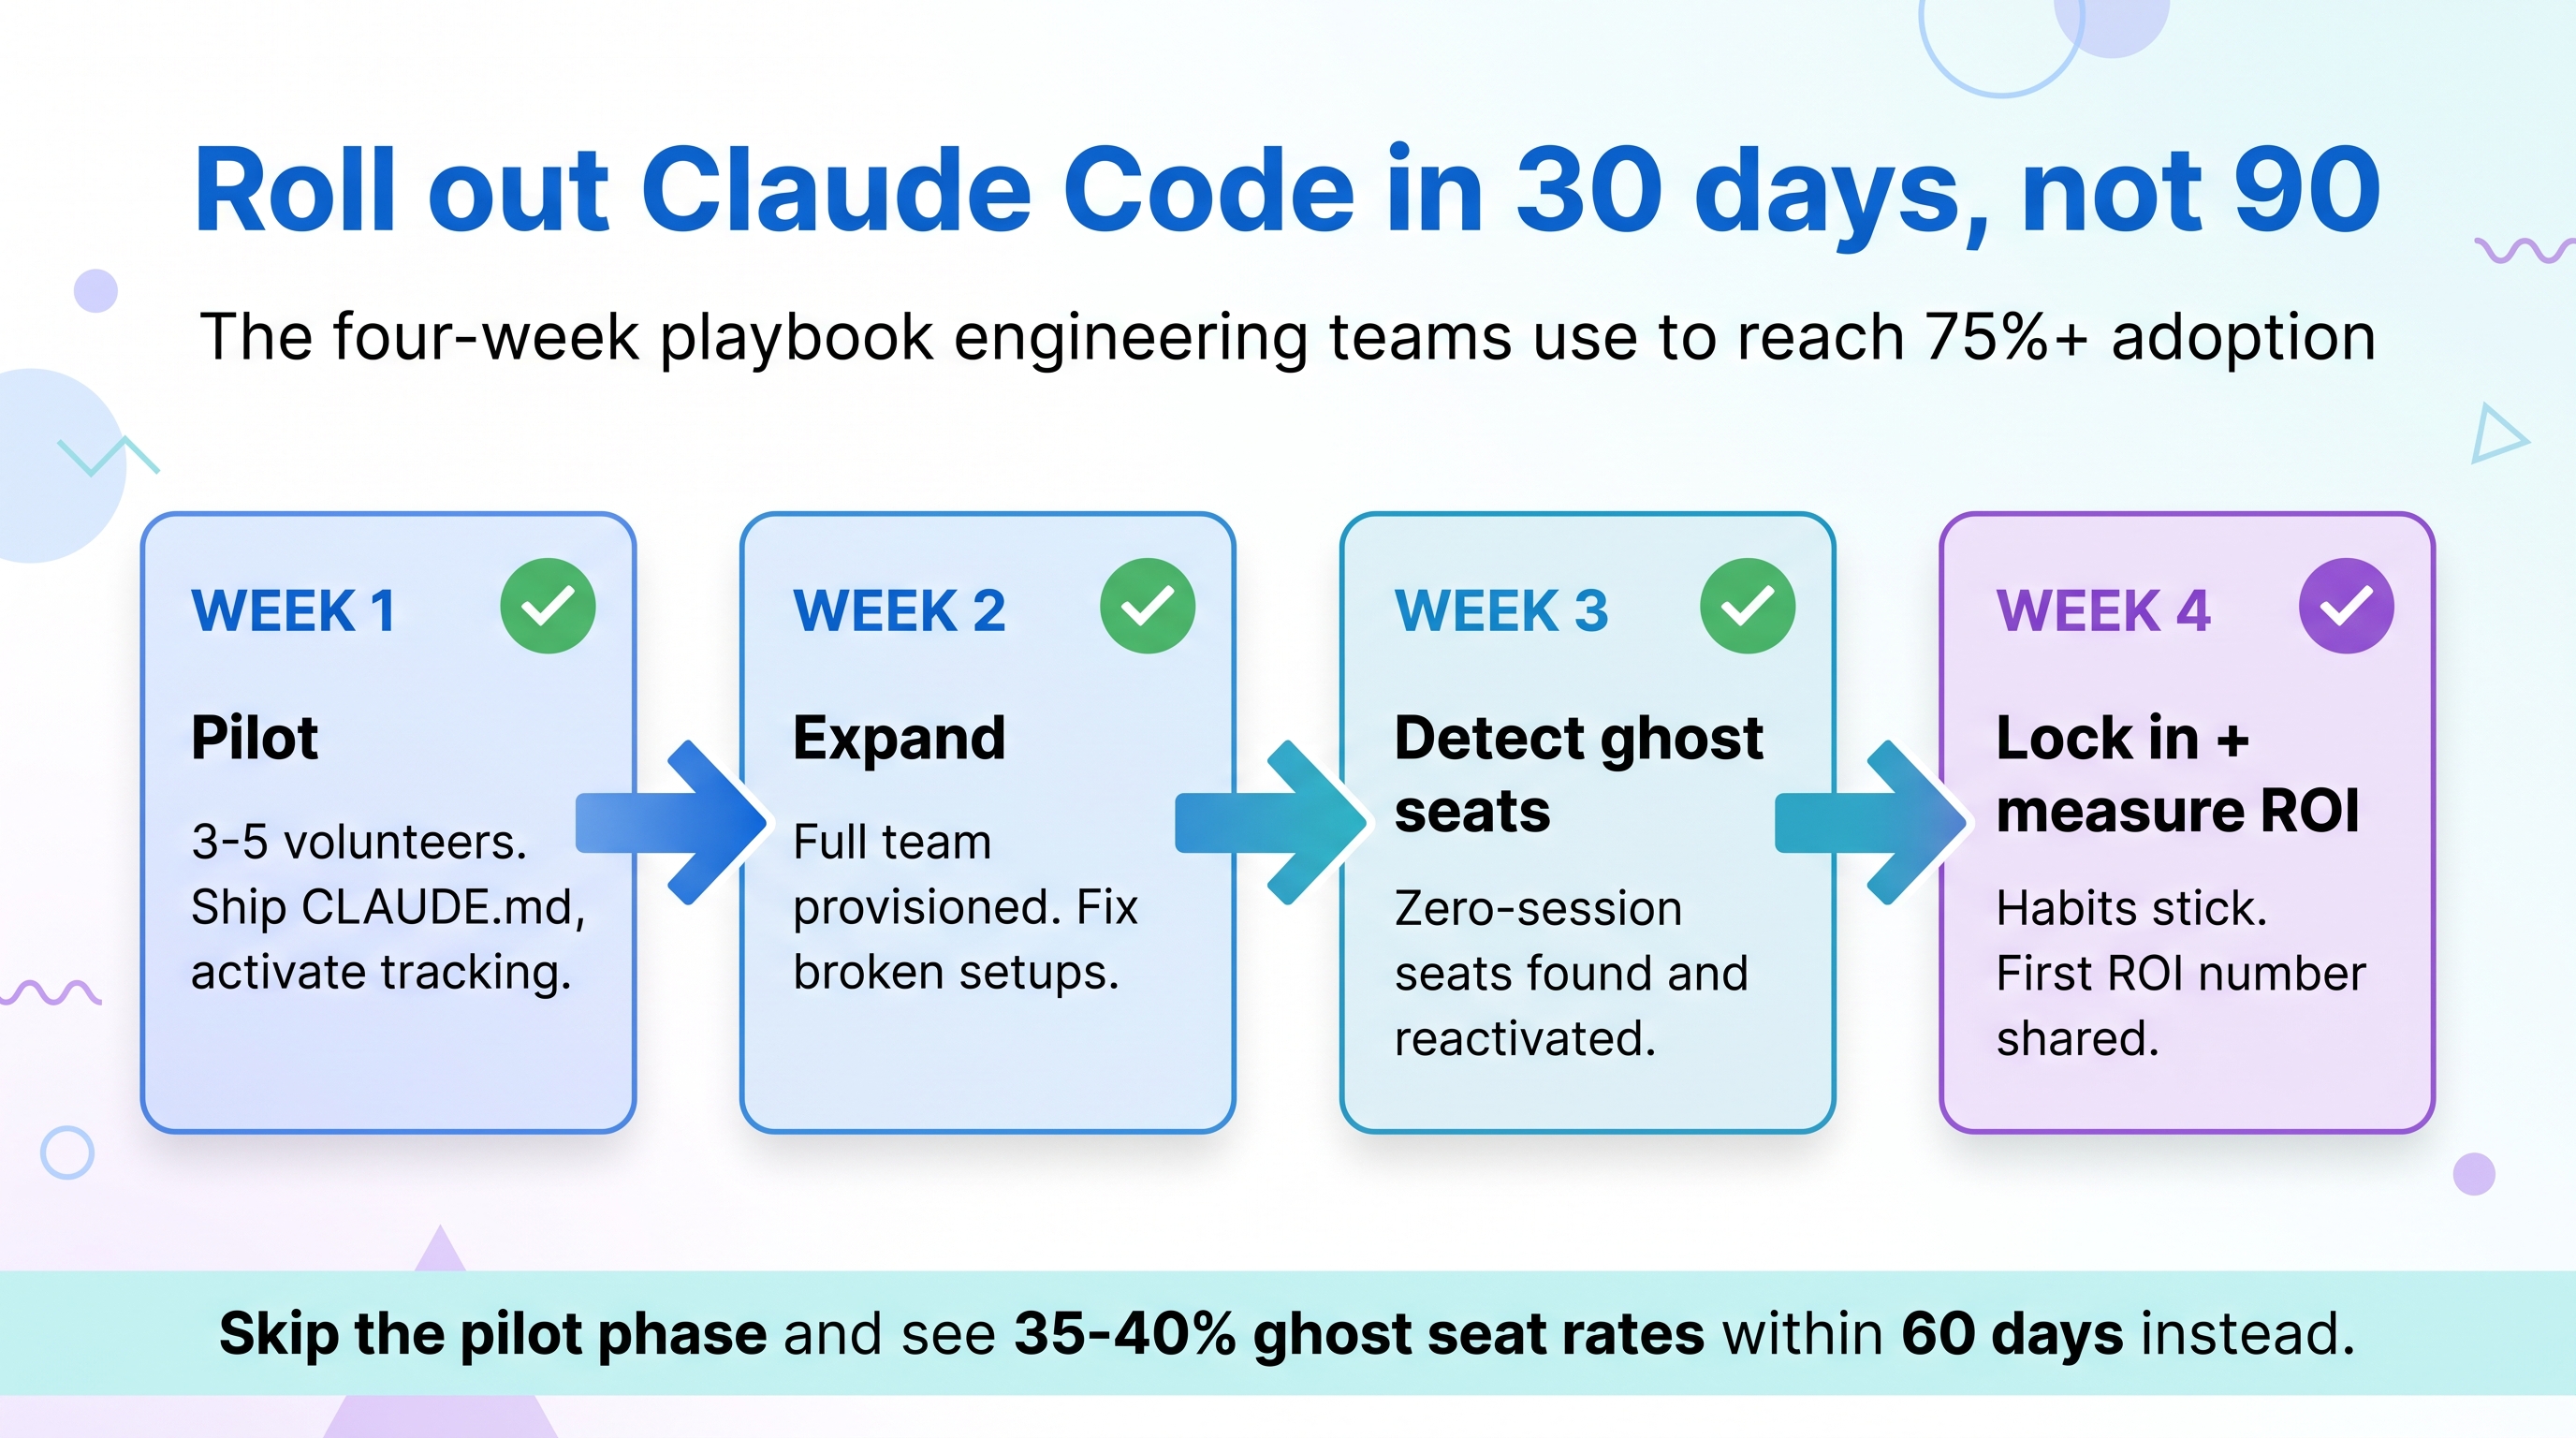
- Roll out in four weeks: pilot with 3-5 volunteers, expand to the full team, detect and fix ghost seats, then lock in habits and measure ROI.
- Track three metrics weekly: weekly active developers, AI-assisted commit ratio, and seat activation rate.
- The median team carries 24% ghost seats at first renewal. Catching them in week 2 instead of at renewal saves $800-$4,800+ a year per team.
- A shared team CLAUDE.md is the single biggest predictor of adoption: 1.8x higher AI-assisted commit ratios at day 30.
What should engineering managers do before rolling out Claude Code?
Three steps before day one — licensing allocation, a team-level CLAUDE.md, and usage tracking — determine whether your rollout reaches 75%+ adoption at day 30 or plateaus at 45% with an invisible ghost seat problem.
Step 1: Allocate licences by team, not org-wide
Provision seats by squad or vertical, not all at once. A backend squad of 6 is a manageable pilot unit; an 80-person engineering org is not. Phased licensing prevents the situation where 30 developers activate accounts on day one, half go dark by day 14, and no one notices until renewal.
If you are using Claude Code via Anthropic API keys (BYOK), set spend limits per team before the rollout starts. Without a cap, a single developer running a long autonomous session can consume a disproportionate share of the monthly budget.
Step 2: Write and ship a team CLAUDE.md before any developer runs Claude Code
The single biggest predictor of 30-day adoption is whether developers have a shared CLAUDE.md file that tells Claude Code how your codebase works. Teams with a team-level CLAUDE.md see 1.8× higher AI-assisted commit ratios at day 30 compared to teams where developers configure Claude Code individually.
A rollout CLAUDE.md needs four sections:
- Codebase conventions: language version, framework, naming patterns, test framework
- Approved task types: what Claude Code can do autonomously vs. what needs human review
- Data handling rules: directories with sensitive data, files Claude Code should not read
- Escalation triggers: output patterns that should prompt the developer to stop and review
Keep it under 400 lines. Longer files show diminishing returns in pilot data.
Step 3: Instrument usage tracking before the first developer runs a session
You cannot detect ghost seats you cannot see. Before any developer activates a licence, connect your AI activity tracking so you have day-one session data for the entire pilot cohort.
CloudByte PMS instruments this automatically — per-developer session counts, AI-assisted commit ratios, and broken-setup detection appear in the dashboard from the first session. Without this, you will discover ghost seats at renewal, not in week two.
What does a 30-day Claude Code rollout timeline look like?
A four-week rollout — pilot, expand, measure, lock — produces 70–80% weekly active developer rates at day 30 for teams that follow all four phases; skipping the pilot phase cuts this to 45–55%.
| Week | Goal | Key action | Success signal |
|---|---|---|---|
| Week 1 | Pilot with 3–5 volunteers | Ship CLAUDE.md, activate tracking, hold two 30-min walkthroughs | Every pilot developer logs at least 5 sessions |
| Week 2 | Expand to full team | Provision remaining seats, fix broken setups flagged by monitoring | 70%+ of provisioned seats log at least one session |
| Week 3 | Detect and fix ghost seats | Review session counts by developer, reach out to zero-session seats | Ghost seat count falls to under 10% of provisioned seats |
| Week 4 | Lock in habits and measure ROI | Share first ROI estimate with team, publish AI-assisted commit ratio | 75%+ weekly active developers, AI-assisted commit ratio above 40% |
The pilot phase (week 1) is the most commonly skipped step. It matters because volunteers surface CLAUDE.md gaps, IDE plugin issues, and API key problems that would otherwise affect every developer simultaneously in week 2.
How do you track Claude Code adoption across your engineering team?
Track three metrics weekly: weekly active developer count, AI-assisted commit ratio, and seat activation rate — together they tell you whether adoption is growing, stalling, or collapsing into ghost seats.
Each metric answers a different question:
- Weekly active developers: are developers forming a consistent habit, or using Claude Code once and forgetting it?
- AI-assisted commit ratio: are developers using Claude Code for real work tasks, or only for quick one-off questions?
- Seat activation rate: have all provisioned seats been activated at least once? Zero-activation seats after day 14 are almost always permanent ghost seats.
What "weekly active" means. Define it before your rollout: at least one Claude Code session of 10+ minutes, or at least one AI-assisted commit in the past 7 days. A loose definition (any session, any length) inflates your active rate and hides shallow usage.
Per-developer data matters more than team averages. A 60% weekly active rate with 6 power users and 4 inactive developers looks identical in aggregate to 10 developers each using Claude Code at a moderate level — but the intervention needed is completely different.
CloudByte PMS breaks down AI-assisted commit ratios per developer, alongside session depth and last-active timestamps, so you can distinguish a developer who is consistently productive with Claude Code from one who activated their account and never came back.
How do you detect ghost seats during a Claude Code rollout?
Ghost seats are provisioned Claude Code licences with zero sessions in the past 28 days. Detect them by filtering your AI activity data by developer session count = 0 — and do it in week 2, not at renewal.
In CloudByte PMS data, the median engineering team carries 24% ghost seats at their first Claude Code renewal. For a 20-seat team at $14/seat/month, that is $67/month in waste — $806/year. For a 50-seat team it is $168/month.
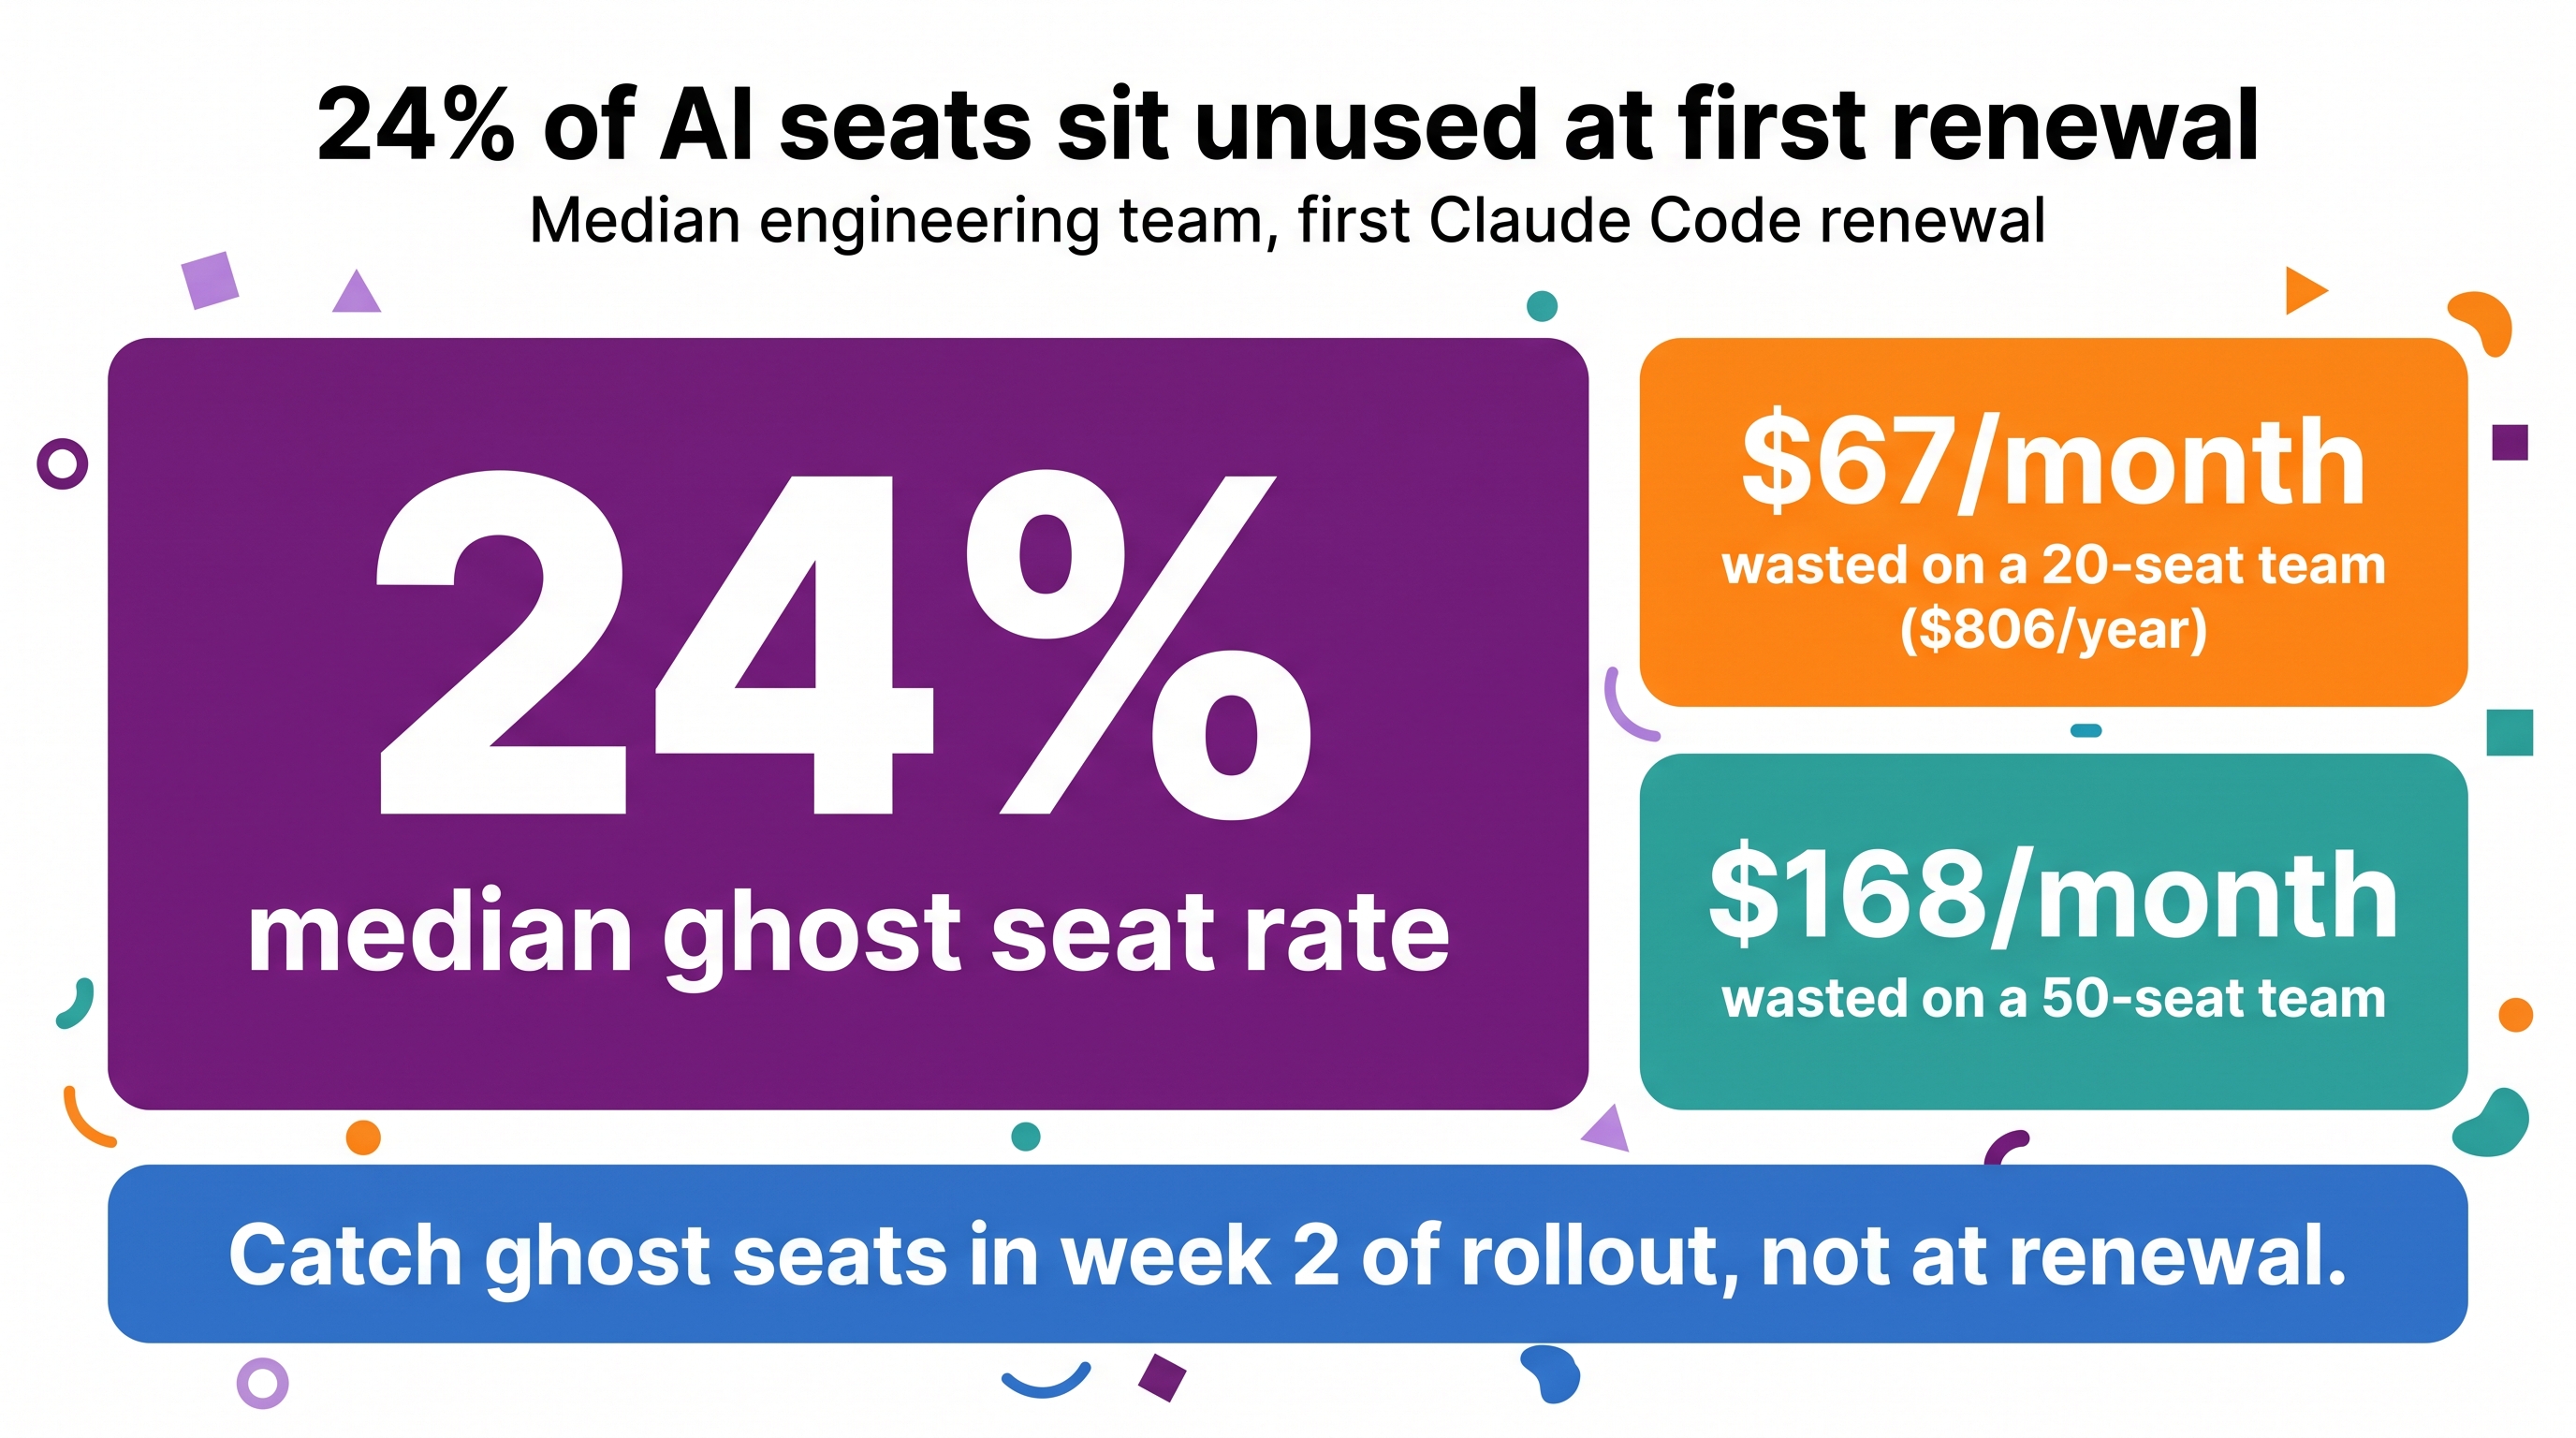
The critical detection window is week 2 to week 3 of the rollout. Developers who have zero sessions by day 14 almost never activate spontaneously — without intervention, they become permanent ghost seats. With a brief 15-minute session to diagnose the issue (IDE plugin not installed, API key misconfigured, onboarding missed), 80% of week-2 zero-session seats become active.
By week 4, the window closes. A developer at zero sessions after day 30 typically needs a more involved conversation about whether Claude Code fits their workflow — or whether the seat should be reallocated to a developer on a different squad.
Ghost seat signal. If a developer has zero sessions after 14 days, the most common causes are: (1) IDE plugin not installed, (2) API key not configured or expired, (3) network firewall blocking the Anthropic API, (4) developer onboarding was missed entirely. Check in this order before assuming low motivation.
For more detail on finding and eliminating ghost seats across AI coding tools, see Ghost Seats: How to Find and Reclaim Unused AI Coding Licences.
What metrics predict a successful Claude Code rollout?
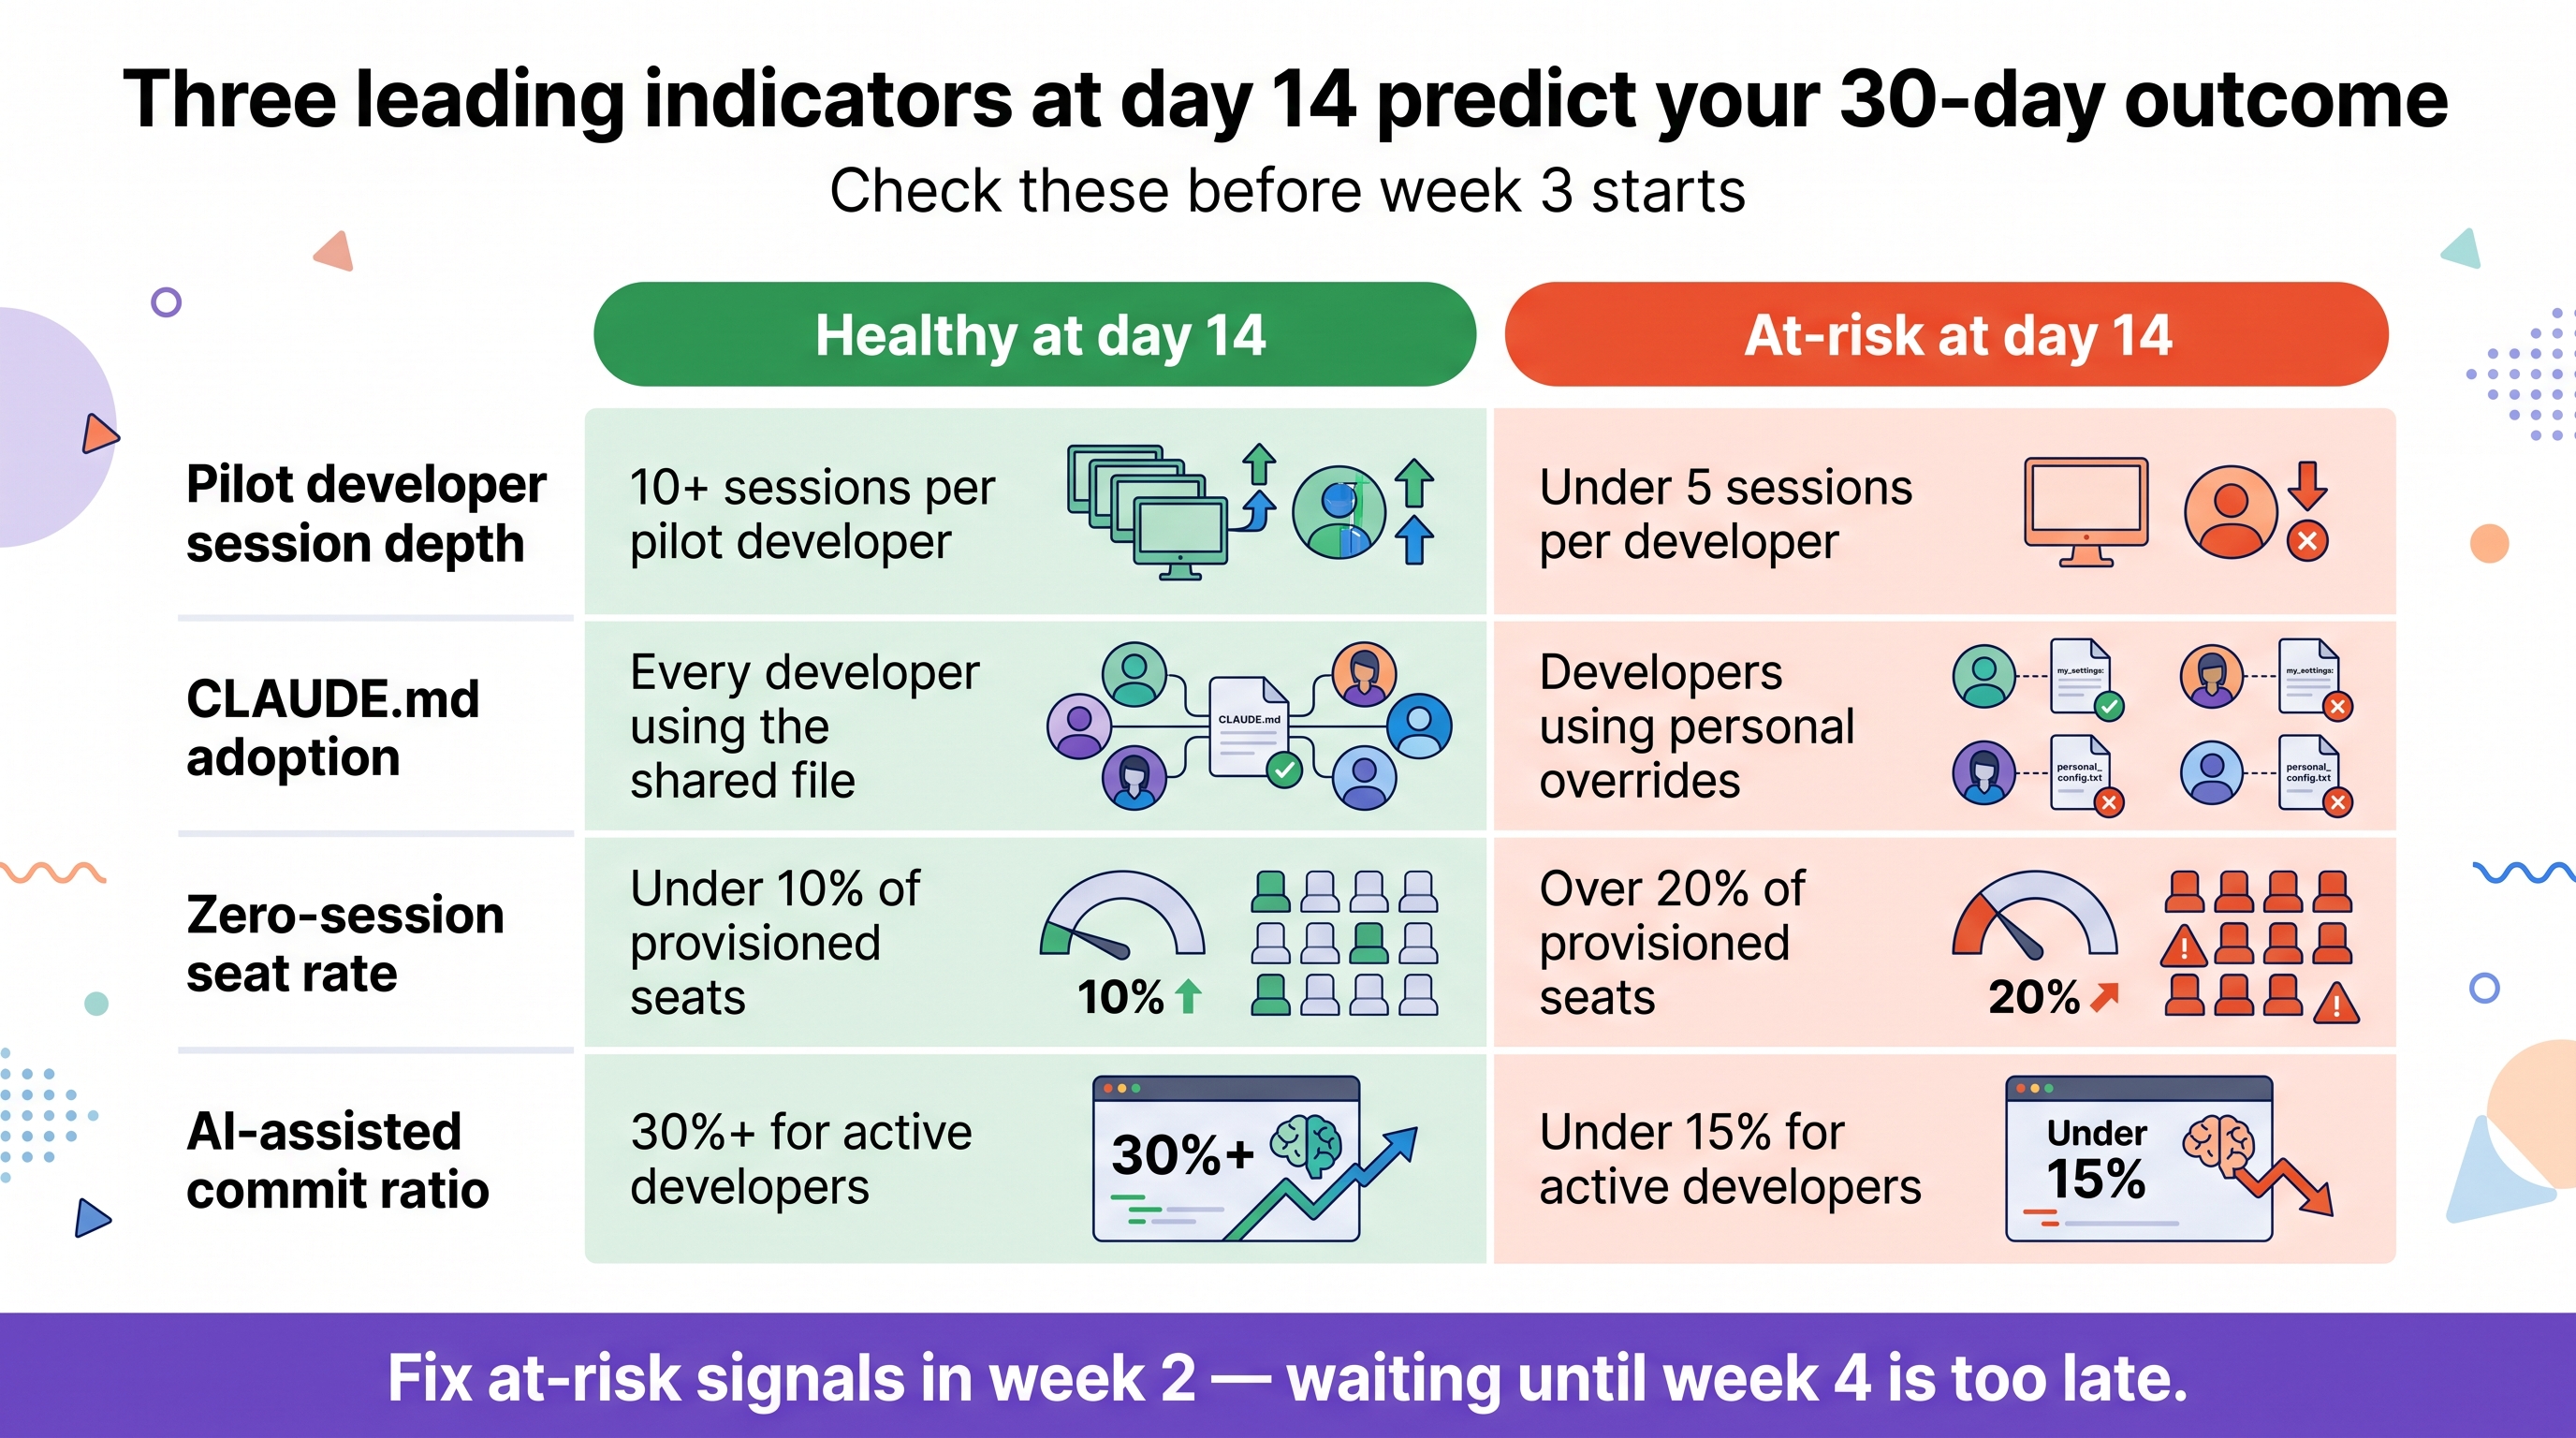
Three leading indicators at day 14 predict 30-day adoption outcome: pilot developer session depth (10+ sessions per pilot developer in week 1), CLAUDE.md adoption rate (every developer working from the shared file), and zero-session seat rate (under 10% of provisioned seats).
| Indicator | Healthy at day 14 | At-risk at day 14 |
|---|---|---|
| Pilot developer session depth | 10+ sessions per pilot developer | Under 5 sessions per developer |
| CLAUDE.md adoption | Every developer using the shared file | Developers using personal overrides |
| Zero-session seat rate | Under 10% of provisioned seats | Over 20% of provisioned seats |
| AI-assisted commit ratio | 30%+ for active developers | Under 15% for active developers |
| Broken-setup alerts | Zero | Any broken-setup alert unresolved for 48h |
The AI-assisted commit ratio is the most actionable of these. If active developers have high session counts but a low AI-assisted commit ratio (say, 5 sessions per developer per week but only 10% of commits AI-assisted), developers are using Claude Code for exploration and question-answering but not for the core coding workflow. This usually means CLAUDE.md does not cover the actual tasks developers run most often.
For teams tracking DORA metrics alongside AI activity, see How AI Coding Tools Change Your DORA Metrics — the AI-assisted commit ratio maps directly onto lead time improvement, and the correlation becomes statistically reliable by week 6.
To calculate the dollar ROI of your rollout at day 30, use the AI Coding ROI Calculator framework — it walks through the hours-saved calculation using your actual session and commit data.
FAQ: rolling out Claude Code to your engineering team
How long does it take to roll out Claude Code to a 20-person engineering team?
A structured 30-day rollout: pilot with 3-5 volunteers in week 1, expand to the full team in week 2, detect ghost seats in week 3, and lock in habits by week 4. Teams that skip the pilot and provision everyone on day one see 35-40% ghost seat rates within 60 days.
What metrics should an engineering manager track when rolling out Claude Code?
Three metrics predict adoption: weekly active developers, AI-assisted commit ratio, and seat activation rate. A healthy day-30 rollout hits 75%+ weekly active developers and 40%+ AI-assisted commit ratio. Per-developer data matters more than team averages, since a 60% active rate can hide very different situations.
How do you detect ghost seats during a Claude Code rollout?
Filter your AI activity data for developers with zero sessions in the past 28 days. The critical window is weeks 2-3: zero-session seats at day 14 rarely self-activate. A 15-minute check-in to diagnose the cause (IDE plugin, API key, missed onboarding) reactivates about 80% of them.
What should a team CLAUDE.md file include for a Claude Code rollout?
Four sections: codebase conventions (language, framework, naming), approved task types (autonomous vs. human-reviewed), data handling rules for sensitive directories, and escalation triggers. Keep it under 400 lines - longer files show diminishing returns. Teams with a shared CLAUDE.md see 1.8x higher AI-assisted commit ratios at day 30.
What is a realistic Claude Code adoption rate after 30 days?
Teams with a structured rollout reach 70-80% weekly active developer rates by day 30; teams without one average 45-55%. The gap widens by day 60 as ghost seat rates diverge - structured teams trend toward 85%, unstructured teams toward 35-40%. For the dollar value of that gap, see the AI Coding ROI Calculator framework.