GitHub Copilot vs Claude Code: track ROI
Ran a 30-day, 29-seat GitHub Copilot vs Claude Code pilot and built the tracking layer behind the data in this post.
You've rolled out GitHub Copilot, Claude Code, or both. Licenses are paid. Developers are (supposedly) using them. But when your CFO (chief financial officer) asks "is this working?", what do you say?
If your answer is anything other than a number — session counts, productivity multiplier, cost per output — you don't have an answer. You have a guess.
This post is the framework for turning that guess into a number. What to measure, how to measure it, and what the data tells you about whether you've chosen the right tool for your team.

What metrics should engineering managers track for AI coding tool ROI?
Track five metrics: active seat rate, session depth, productivity multiplier by project type, PR (pull request) cycle time delta, and cost per productive session. Everything else is a proxy for one of these.
Here's what each metric tells you and why it matters:
1. Active seat rate
Active seat rate = (seats with at least one session this week) ÷ (total paid seats). A seat with no sessions is a ghost seat — you're paying for zero output.
Based on our 30-day rollout across 29 seats: a healthy active seat rate at 90 days is 60–70%. If you're below 40%, you have a ghost seat problem worth auditing before the next renewal. We found 7 of 29 seats (24%) had zero sessions in the first 30 days — a common pattern in bulk AI tool rollouts. (Full ghost seat analysis here.)
2. Session depth (prompts per session)
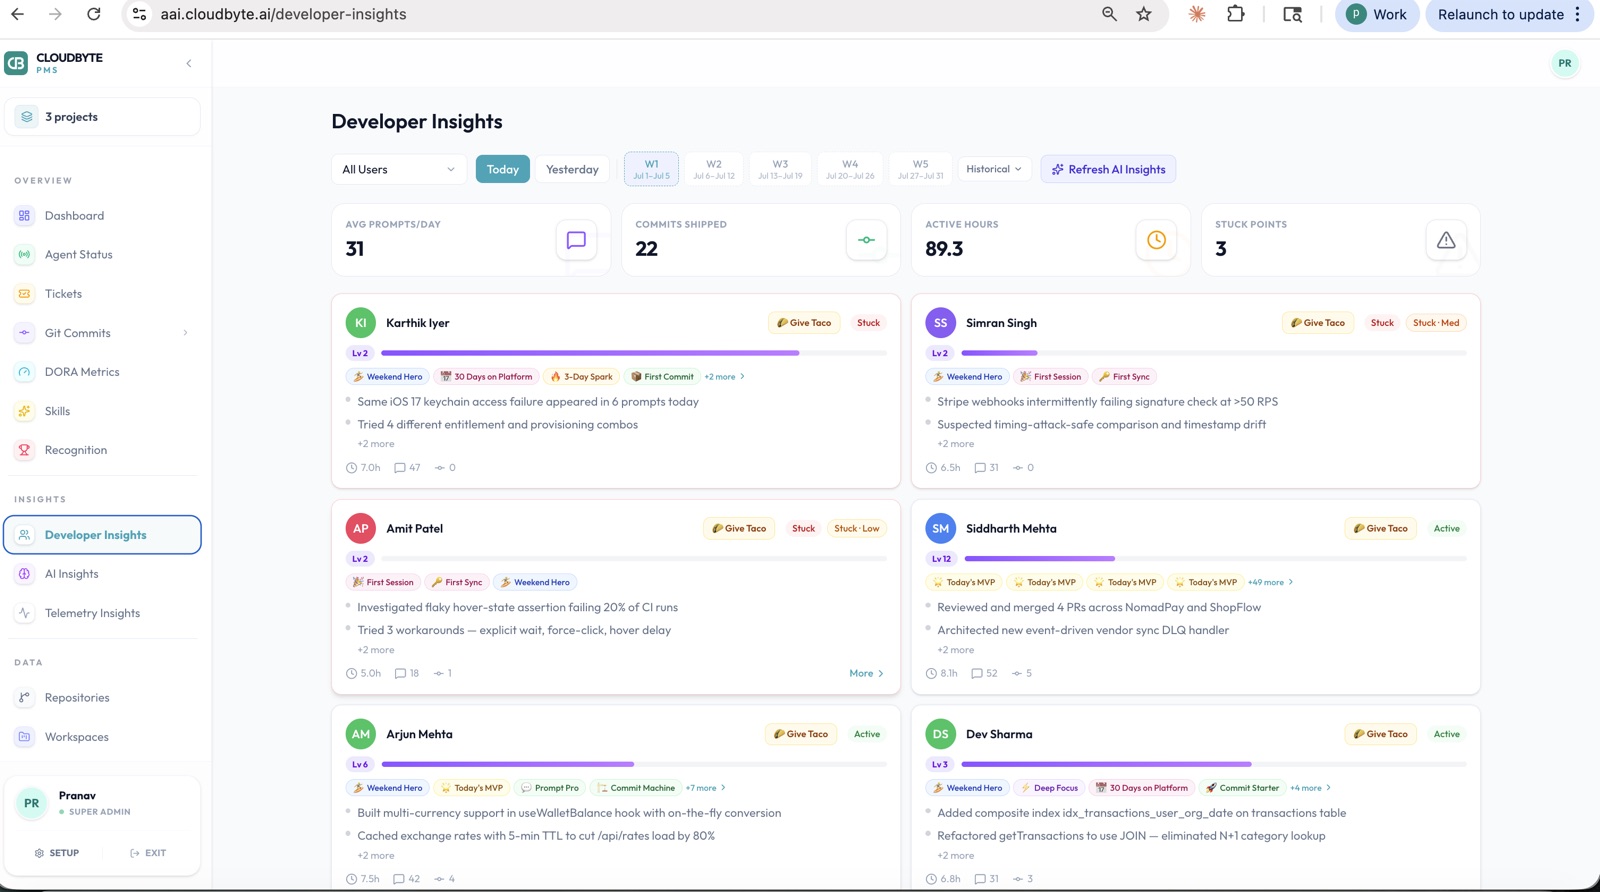
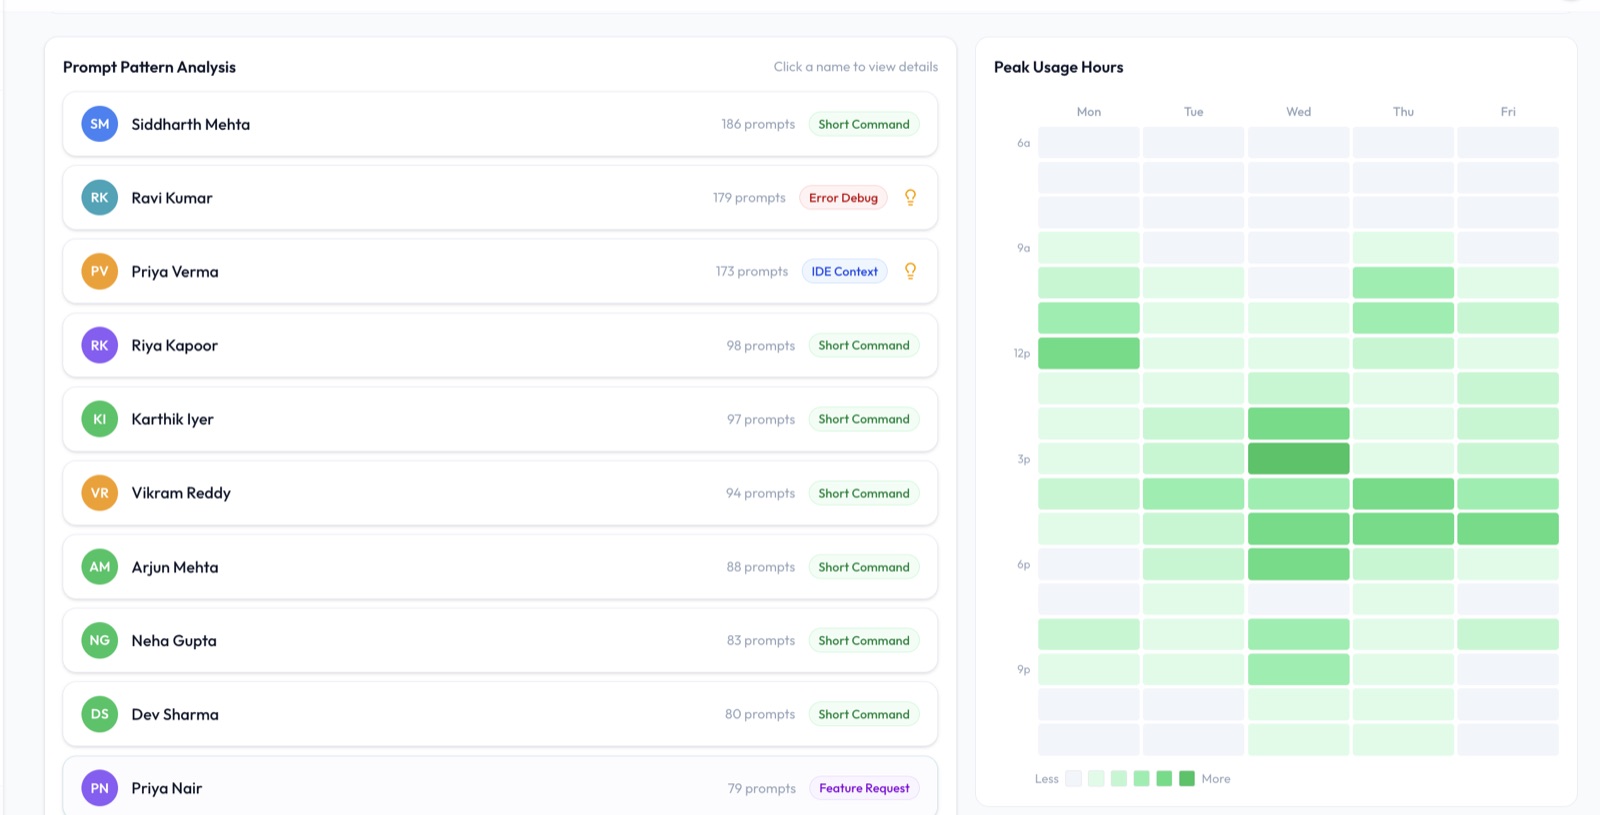
Session depth measures how substantively developers are using the tool — not just that they opened it, but that they stayed and had a real conversation with it.
In our Copilot vs Claude Code split test, Claude Code averaged 7.4 prompts per session vs. Copilot's 3.1. This reflects a fundamental difference in the interaction model: Copilot is a completion engine (one suggestion at a time), Claude Code is a conversation partner (multi-step tasks in a single thread). Neither is better; they measure different things. But knowing your team's session depth tells you whether the tool is being used superficially or substantively.
3. Productivity multiplier by project type
The multiplier is the ratio of AI-assisted output to baseline output — commits per week, story points delivered, PRs merged. It should be measured per project type, not as a single team average.
Our data:
| Project type | Claude Code multiplier | Copilot multiplier |
|---|---|---|
| Backend API development | 2.8× | 1.4× |
| Frontend React / TypeScript | 1.9× | 1.6× |
| Infrastructure / DevOps | 1.0× | 1.2× |
| Legacy code maintenance | 0.8× | 0.9× |
| Team-wide average | 1.8× | 1.4× |
A single team-wide average hides everything useful. If your team is infra-heavy, a 1.8× average for Claude Code is a fiction — your real number is 1.0×. If you're building API-heavy software, it may be 2.8×. Segment by project type before drawing conclusions.
4. PR cycle time delta
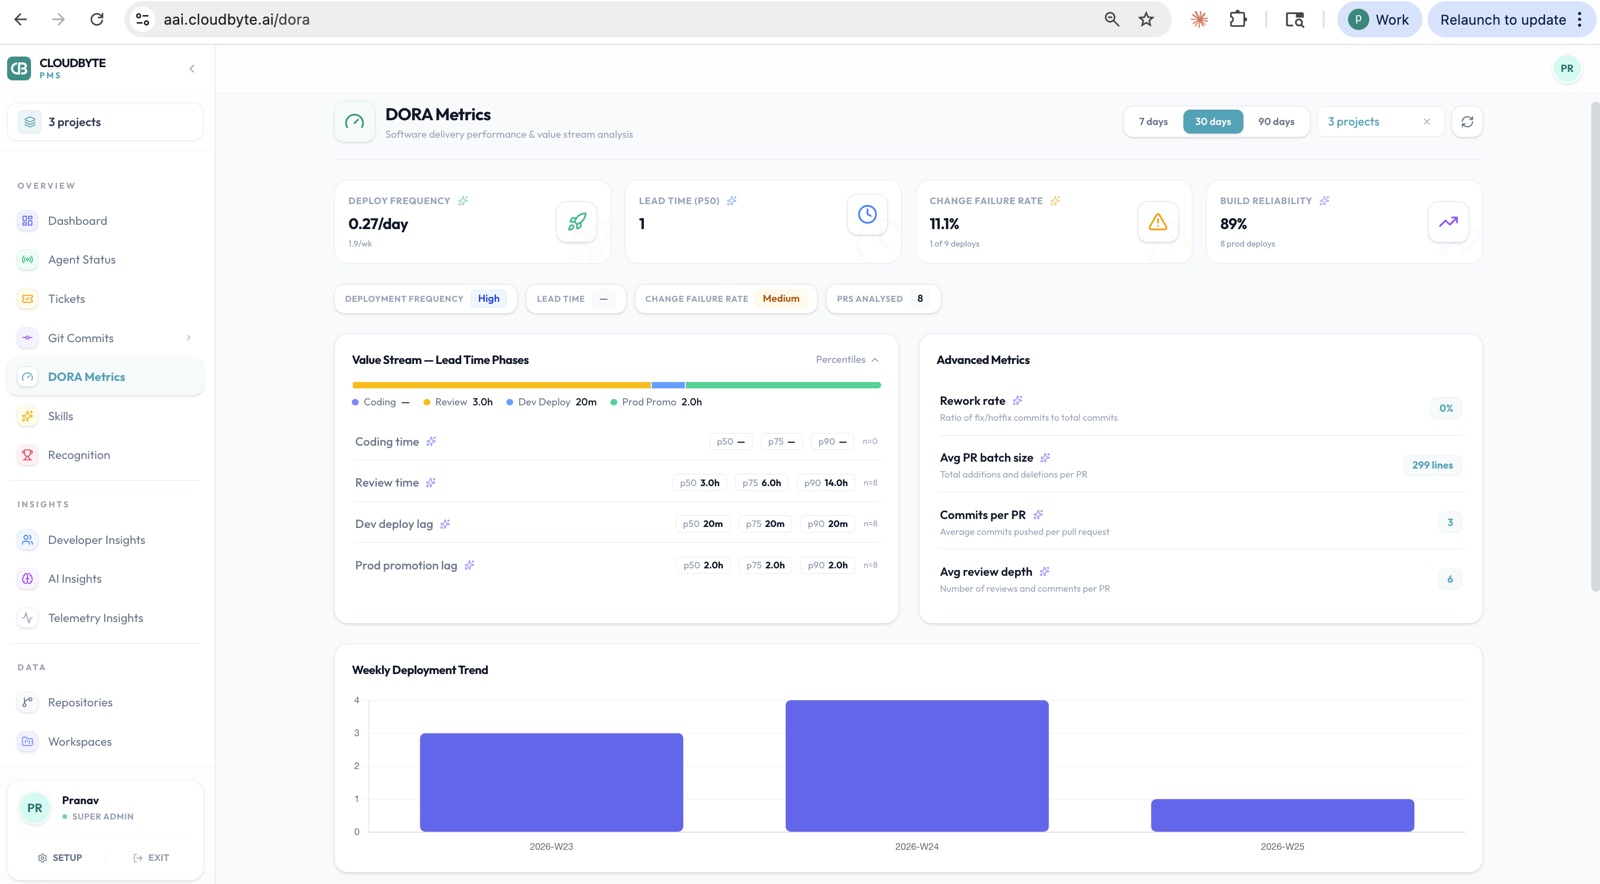
PR cycle time (open to merge) is a clean proxy for AI tool effectiveness on code quality and review burden. If AI is helping, PRs should get faster: better first drafts, more complete test coverage, clearer commit messages.
In our data, Claude Code reduced PR cycle time by 25% (2.8 days → 2.1 days) over the 30-day measurement period. Copilot's impact was smaller (2.8 days → 2.5 days), reflecting the difference in session depth — shallow completions produce less improvement to review burden than multi-step code generation.
5. Cost per productive session
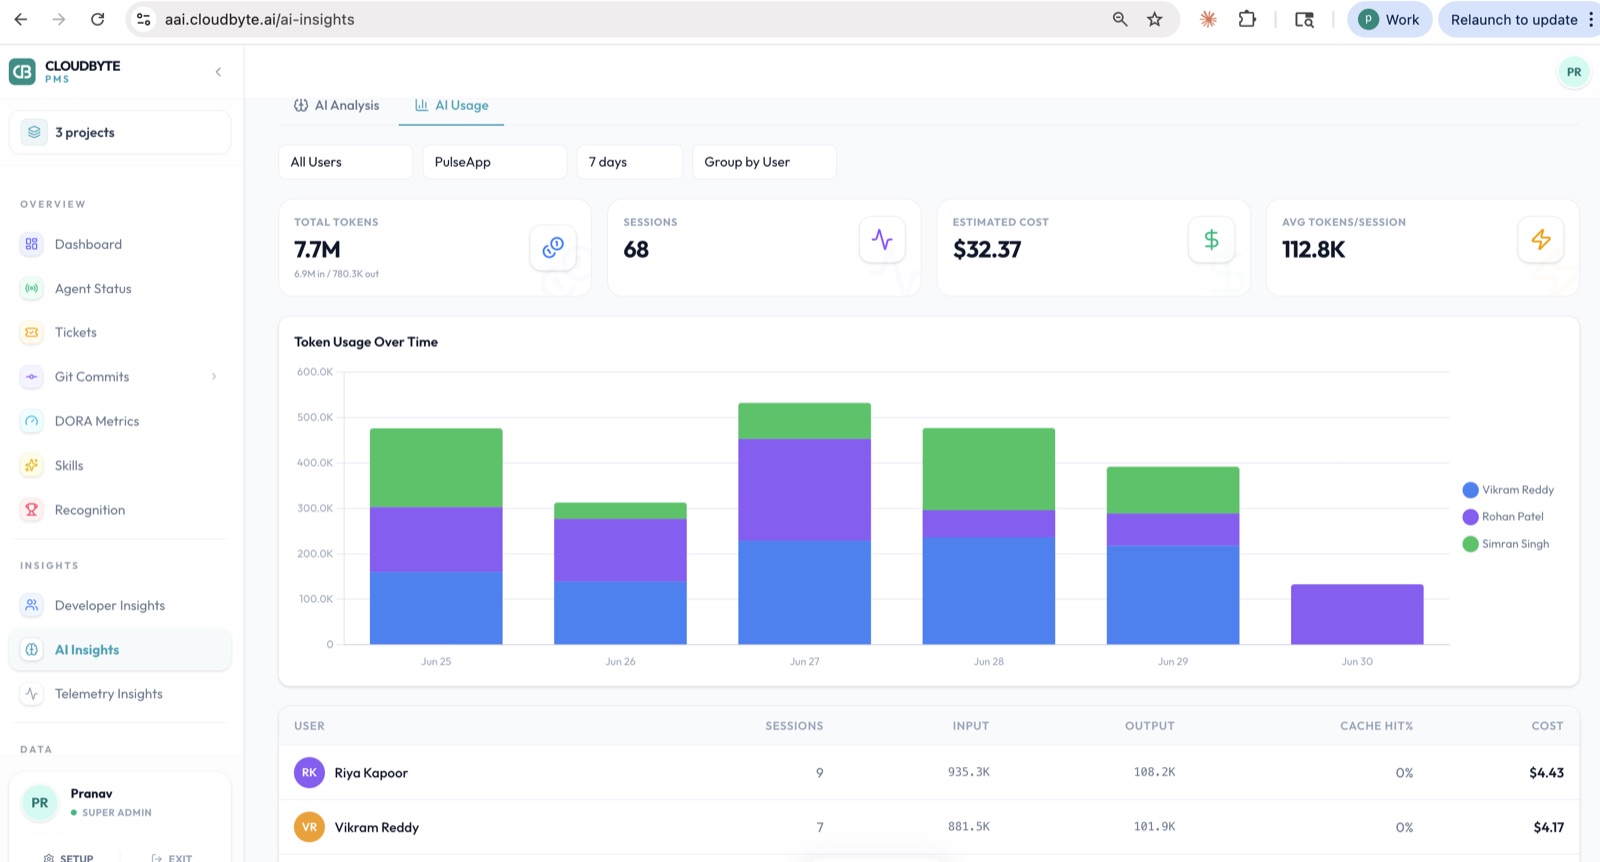
Cost per productive session = (monthly tool spend ÷ sessions with meaningful output). "Meaningful output" is sessions with 3+ prompts and at least one associated commit — a proxy for genuine work, not accidental clicks.
This is the number that justifies or challenges the line item. At $19/seat/month for Copilot Enterprise (50+ seats) across a 30-developer team with 1,200 productive sessions per month: $0.48 per session. Compare that to developer hourly rate × time saved per session. If a session saves 30 minutes at $85/hour, the ROI on a $0.48 cost is not a hard conversation.
How does GitHub Copilot's built-in analytics compare to Claude Code's?
GitHub Copilot Enterprise exposes seat-level activity data via REST API; Claude Code has no built-in team analytics. Neither tool gives you the management layer you actually need.
| Analytics capability | GitHub Copilot Enterprise | Claude Code | External tracking layer |
|---|---|---|---|
| Active seat count | ✅ Via API | ❌ | ✅ |
| Last activity date per seat | ✅ last_activity_at | ❌ | ✅ |
| Per-developer session count | ❌ | ❌ | ✅ |
| Session depth (prompts/session) | ❌ | ❌ | ✅ |
| Productivity multiplier | ❌ | ❌ | ✅ |
| Project-level activity breakdown | ❌ | ❌ | ✅ |
| Commit attribution to AI sessions | ❌ | ❌ | ✅ |
| Ghost seat detection | Partial | ❌ | ✅ |
| PR cycle time delta | ❌ | ❌ | ✅ |
| Real-time agent health monitoring | ❌ | ❌ | ✅ |
Copilot's GET /orgs/{org}/copilot/billing/seats API endpoint returns a last_activity_at timestamp per seat. This tells you whether a seat has ever been used — useful for ghost seat audits — but nothing about how it was used. You can see that a developer opened Copilot on Tuesday. You cannot see how many prompts they ran, which project they were working on, or whether those prompts produced any commits.
Claude Code doesn't expose any team-level data at all. There's no vendor dashboard, no API, and no aggregate reporting. You know you paid for seats. You do not know if those seats are running sessions.
The visibility gap is the ROI gap. A tool with a 1.4× multiplier you can see and act on is more valuable than a tool with a 1.8× multiplier you're guessing about. Visibility lets you fix ghost seats, support struggling developers, and report to finance with numbers. Without it, you're relying on vibes.
How do you calculate ROI for GitHub Copilot vs Claude Code?
ROI = (hours saved × average developer hourly cost) − tool cost. The challenge is that "hours saved" requires session data you have to measure yourself.
The formula
Hours saved per month = sessions × average minutes saved per session ÷ 60
Monthly value = hours saved × developer hourly rate
Monthly ROI = monthly value − monthly tool cost
Annualized ROI = monthly ROI × 12
Example calculation: 30-developer team
Assumptions based on our pilot data:
- 30 developers, 40 Claude Code sessions/developer/month (at 60% active seat rate)
- Average 45 minutes saved per productive session (conservative estimate)
- Average developer fully-loaded cost: $85/hour
- Tool cost: $15/seat/month (CloudByte PMS tracking layer) + $0 for Claude Code API (bring your own key, or BYOK, model)
Sessions: 30 × 40 = 1,200 sessions/month
Hours saved: 1,200 × 45min ÷ 60 = 900 hours
Monthly value: 900 × $85 = $76,500
Tool cost: 30 × $15 = $450/month
Monthly ROI: $76,500 − $450 = $76,050
Annualized: $912,600 on a $5,400/year tracking investment
$76,050/month ROI on a $5,400/year tracking investment. At conservative assumptions, the tracking layer costs ~0.6% of the engineering value it lets you demonstrate and manage.
The leverage ratio is what makes the argument to finance. The tracking layer costs 0.6% of the value it lets you demonstrate and manage.
Even with conservative estimates — 20 minutes saved per session, 50% active seat rate — the math works at almost any team size above 10 developers.
The ROI calculation only works if you have session data. That's the circular constraint: you need external tracking to run the calculation, but the ROI of the tracking layer is proving the ROI of the AI tool. Start with the tracking layer, run it for 30 days, then run the numbers.
What is a good adoption rate benchmark for AI coding tools?
Based on enterprise rollout data, a 60–70% weekly active seat rate at 90 days is typical for a well-supported rollout. Below 40% signals a ghost seat problem you should address before renewal.
Here's how adoption typically develops across a 90-day rollout:
| Rollout milestone | Expected active seat rate | What to watch for |
|---|---|---|
| Week 1–2 (onboarding) | 40–60% | Setup failures, "initiated" status with zero sessions |
| Month 1 (stabilization) | 55–70% | Power users emerging; occasional users dropping off |
| Month 2 (optimization) | 60–75% | Prompt governance paying off; laggards re-engaged or reallocated |
| Month 3 (steady state) | 65–80% | Ghost seats resolved; renewal case buildable |
These benchmarks are based on our own 29-seat rollout plus patterns from early CloudByte PMS customers. They assume an active rollout with onboarding support — passive "here's your license" rollouts typically land 15–20 points lower.
The 80% ceiling is real: in most engineering teams, there will always be a subset of developers — infrastructure-focused, highly specialized domain work, personal preference — for whom AI coding tools genuinely don't add value. Chasing 100% active seat rate is the wrong target. Identifying and reallocating the ghost seats is the right one.
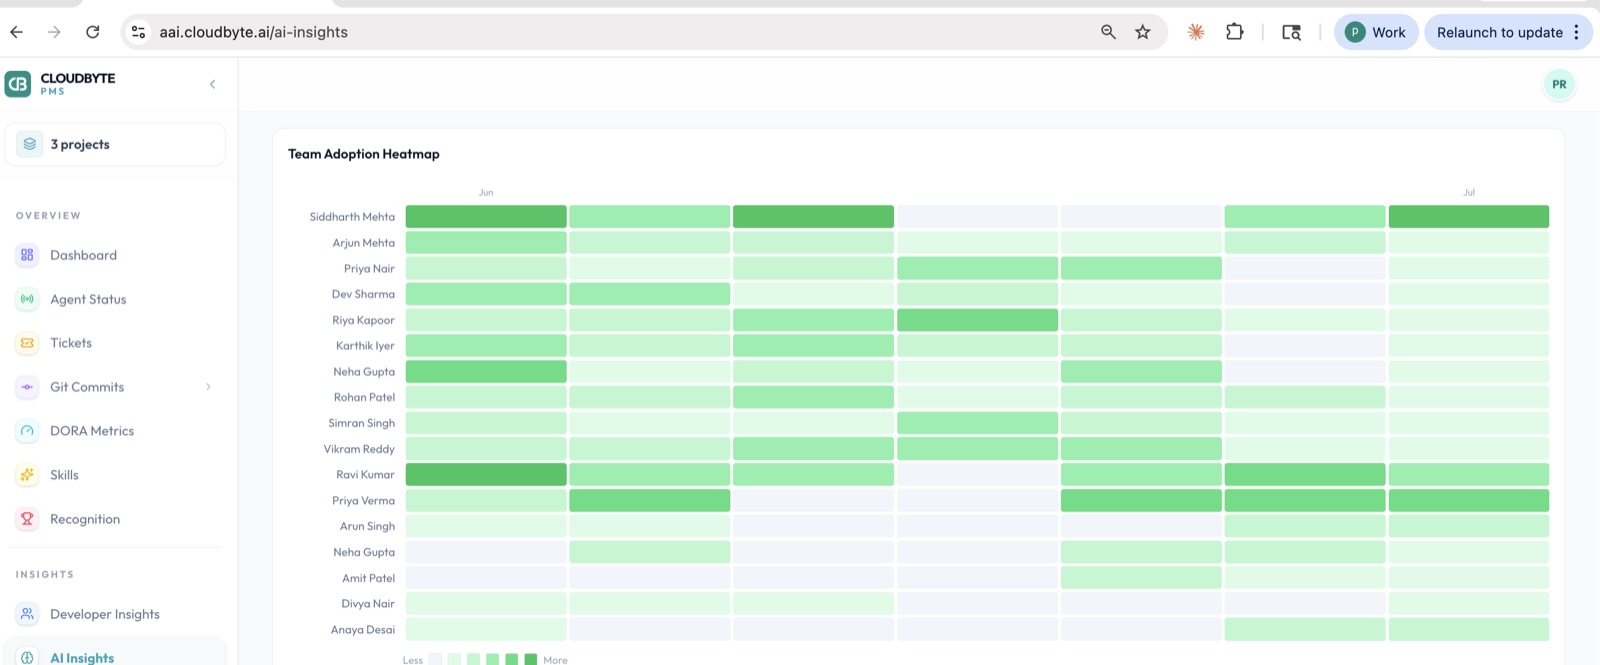
Which tool shows better adoption outcomes: Copilot or Claude Code?
In our 30-day split test, Copilot activated faster (lower setup friction), but Claude Code had 36% more sessions per developer by week 3. The adoption trajectory flips between weeks 2 and 3.
Week-by-week breakdown from our 11-developer cohorts:
| Week | Copilot active % | Claude Code active % | Copilot sessions/dev | Claude Code sessions/dev |
|---|---|---|---|---|
| Week 1 (onboarding) | 82% | 64% | 6.2 | 4.1 |
| Week 2 | 73% | 73% | 14.8 | 18.3 |
| Week 3 | 73% | 82% | 18.2 | 24.7 |
| Week 4 | 73% | 82% | 18.2 | 24.7 |
Copilot's faster initial adoption is structural: the tab-to-accept interaction model requires no prompt discipline. Developers who've never used an AI coding tool can be productive on day one. The flip is also structural: Claude Code's session depth (7.4 prompts vs 3.1) means developers who invest in learning the tool use it more, not less, over time.
The implication for your rollout planning: if you're deploying to a team with low AI tool experience, Copilot's lower friction is a real advantage in the first two weeks. If you have developers willing to invest in prompt discipline, Claude Code's adoption curve catches up quickly and the session depth gap compounds.
How should engineering managers build a monthly AI tool ROI review?
A monthly AI tool review should cover four questions: who is using it, how well it's working, what it's costing, and what to change before next month. Each question has a metric and a decision that follows from it.
Month 1: Establish baselines
Before you can measure improvement, you need a baseline. In month 1:
- Record your pre-AI PR cycle time average (last 90 days of PRs)
- Count current active seat rate and identify ghost seats
- Set session depth targets per developer tier (power users: 30+ sessions/month; regular: 15–29; occasional: 5–14)
- Calculate current tool cost per seat
Don't make conclusions in month 1. You're setting the measurement framework.
Month 2: Identify the gaps
In month 2, compare against baselines:
- Which seats are still at zero sessions? Initiate the ghost seat conversation
- Which project types are showing the highest multiplier? Shift more AI-assisted work there
- Is PR cycle time moving? If not, investigate session depth — shallow use won't move review metrics
Month 3: Make the renewal case (or not)
By month 3, you have enough data to answer the question finance will ask: "Is this worth the cost?"
Run the ROI calculation above. If the multiplier and session depth numbers support the cost, renew. If three months of data shows low adoption and no cycle time improvement, you have evidence to either renegotiate the seat count or switch tools — and that evidence matters more than vendor demos.
Present the month 3 data in terms finance understands: "We spent $X on AI tool licenses. We saved Y developer hours. At an average cost of $Z/hour, the tool delivered $N in engineering output above its cost." That's the ROI review. Keep it to one slide.
Frequently asked questions
How often should engineering teams audit AI coding tool adoption?
Monthly for the first quarter; quarterly after steady state is reached. The first 90 days are when ghost seats accumulate fastest — developers who stalled at onboarding, whose setup silently failed, or who tried the tool and stopped. A monthly audit in months 1–3 catches these early. After month 3, adoption tends to stabilize and quarterly reviews are usually sufficient, with a renewal-timing audit 60 days before the contract date.
What is a realistic ROI timeline for GitHub Copilot or Claude Code?
Most teams see measurable PR cycle time improvement within 30–45 days of active use. Meaningful ROI on the full investment (calculated as hours saved vs. tool cost) is typically visible at 60–90 days for teams with high-AI project types (backend API, full-stack feature work). For infrastructure-heavy or legacy-code-heavy teams, the ROI timeline is longer — or the calculation may not support the investment at all. Know your project mix before projecting ROI.
Can you track GitHub Copilot and Claude Code usage in the same dashboard?
Yes. An external tracking layer like CloudByte PMS instruments at the developer machine level rather than the vendor API level — it captures sessions, prompts, and commits regardless of which AI tool generated them. This means you can run Copilot and Claude Code side-by-side and compare output on the same metrics. You can also migrate from one tool to another mid-rollout without losing historical data.
What is the cost of undetected ghost seats?
At standard enterprise pricing ($19–$40 per seat per month), a single ghost seat running for a full year costs $228–$480 in direct license spend. On a 30-seat team where 24% of seats are inactive (the rate we observed), that's 7 ghost seats × $312 average = $2,184 per year in wasted spend. The harder cost is the opportunity cost: seven developers who aren't using an AI tool that could be accelerating their output. The financial case for detecting ghost seats in month 1 rather than month 12 is substantial.
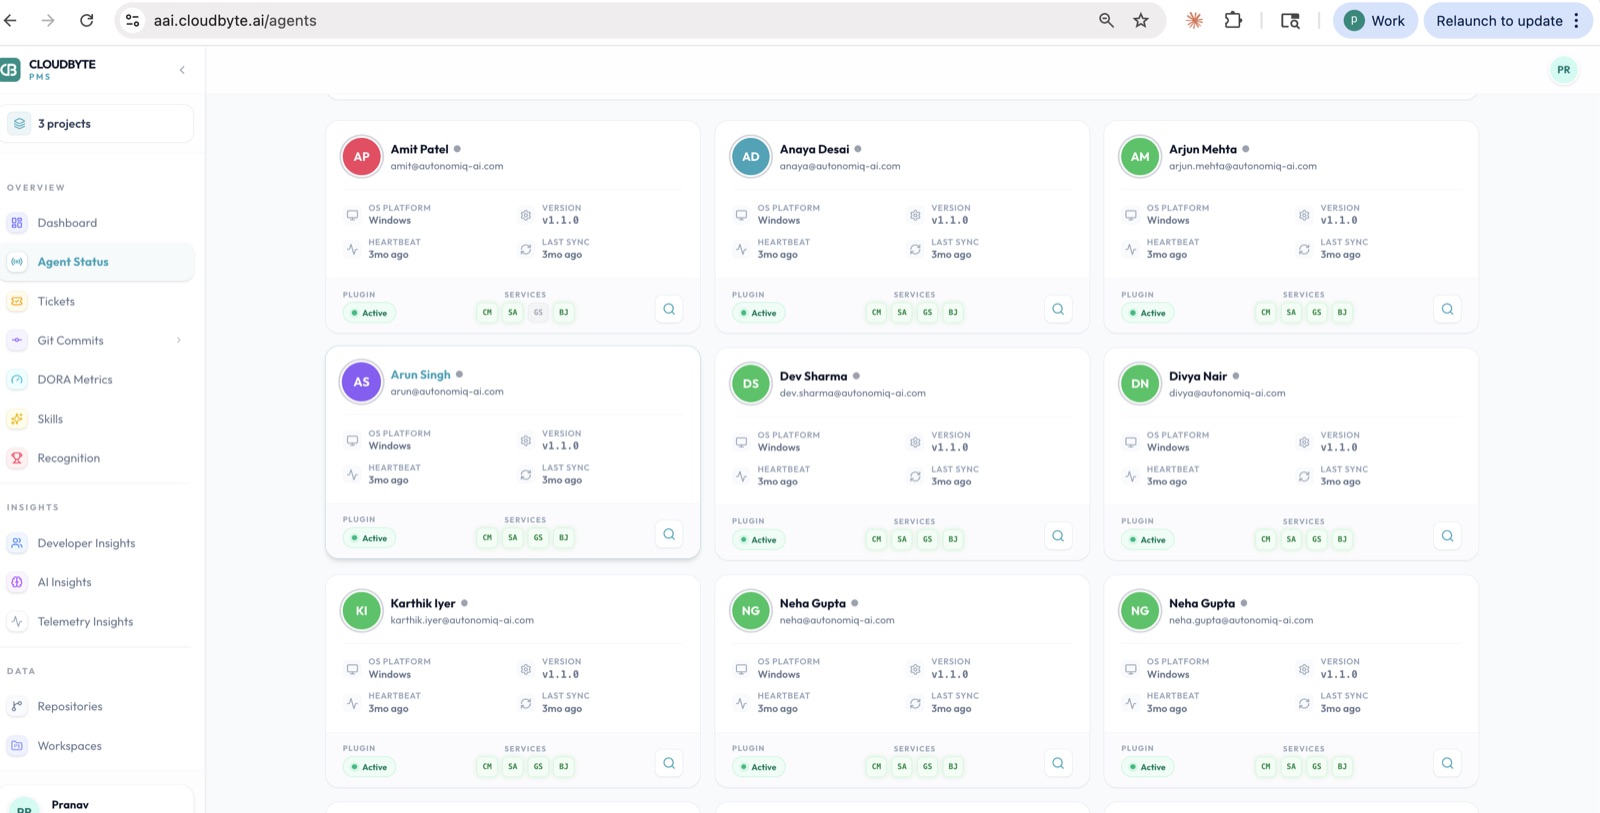
How do you measure Claude Code productivity without built-in analytics?
Claude Code's session data is stored locally in the developer's machine in JSON format under ~/.claude/. An external sync agent can read this data (with developer consent), aggregate it server-side, and expose it as a team-level dashboard. This is how CloudByte PMS works: a lightweight background process reads local session files and pushes heartbeats to the central dashboard. Developers see their own data; admins see the team view. No changes to the Claude Code tool itself are required.
Related reading
- We ran GitHub Copilot and Claude Code side-by-side for 30 days — the productivity comparison this post builds on
- 24% of our AI coding licenses were never activated — the ghost seat detection post with step-by-step audit instructions
- We tracked every AI coding session across our team for 30 days — the full session-level data that informs the multiplier numbers above
- GitHub Copilot vs CloudByte PMS — feature comparison of the tools themselves