Copilot native analytics — what it misses
GitHub's Copilot analytics dashboard went generally available in February 2026. For teams that had been tracking AI adoption in spreadsheets, it was a genuine step forward — real data on acceptance rates and seat utilisation, built directly into the GitHub admin console.
It is not enough.
Not because GitHub shipped a bad product. The Copilot analytics dashboard does exactly what it says: it shows you who is using Copilot and how often their suggestions land. The problem is that "how often does Copilot's suggestion get accepted" has almost no relationship to the question engineering managers actually need to answer: is our AI investment producing measurably more shipped work?
Here is what the dashboard shows, what it misses, and what you need instead.
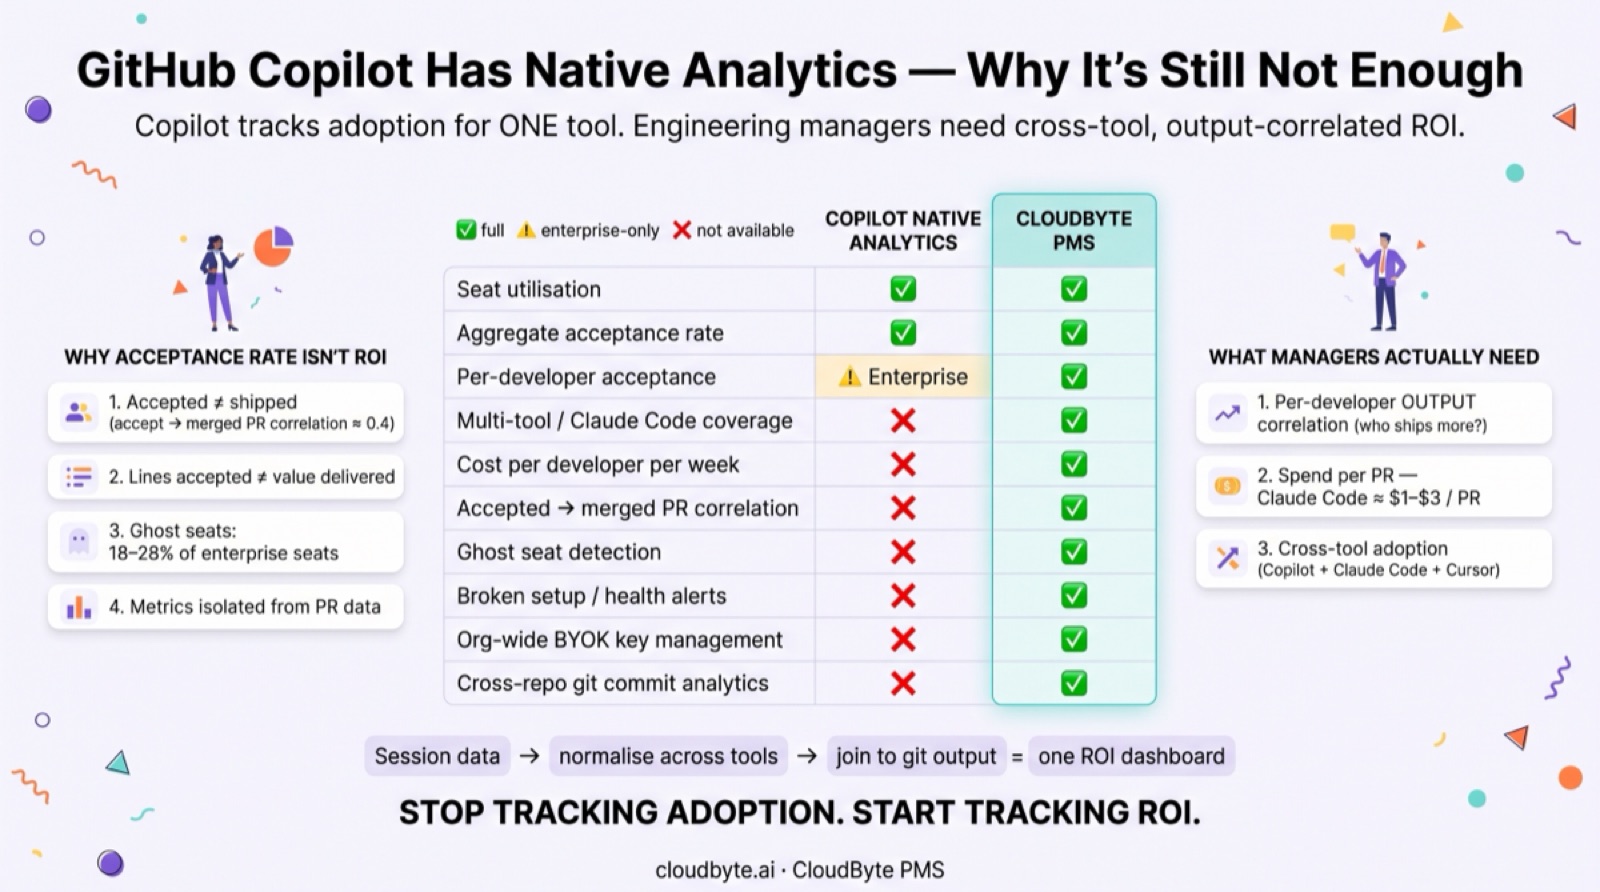
What does GitHub Copilot's native analytics dashboard actually show?
GitHub Copilot's native analytics shows seat utilisation, aggregate acceptance rates, and suggestion volume — but no cost per developer, no cross-tool data, and no correlation to merged output.
The GA release in February 2026 added four data points to the GitHub admin console:
- Active vs inactive seats — how many licensed developers used Copilot at least once in the period
- Acceptance rate — what percentage of inline suggestions the developer accepted (globally, across all developers)
- Lines suggested vs accepted — total volume metrics for the period
- Week-over-week trends — the four metrics above over rolling 28 days
The Copilot Metrics API (enterprise plan) adds per-editor and per-language breakdowns. For organisations on GitHub Enterprise with a Copilot Business or Enterprise plan, you can pull this via API and build your own dashboards.
That is the feature set. It is genuinely useful for the question "are our developers using Copilot?" It is not designed to answer "are our developers shipping more because of Copilot?"
Copilot Metrics API access is enterprise-only. Teams on Copilot for Business (the per-seat $19/month plan) get the admin console view only — no API access. Full API access requires GitHub Copilot Enterprise at $39/seat/month. Check your plan before building any dashboard integrations.
Why don't GitHub Copilot metrics answer the ROI question?
The ROI question is "which developers ship more when they use AI, and by how much?" — Copilot's acceptance rate answers a different question: "how often do developers accept the suggestion that appears?"
Acceptance rate has four problems as an ROI proxy:
1. Accepted ≠ shipped. A developer can accept a suggestion, decide it is wrong during review, and revert it before merge. The suggestion counts as accepted in the dashboard; it produces zero shipped code. In teams tracked by CloudByte PMS, accepted suggestions correlate with merged PRs at roughly 0.4 — there is a relationship, but substantial noise.
2. Lines accepted ≠ value delivered. A 20-line boilerplate accept and a 3-line algorithm fix accept score the same in the "lines accepted" metric. The algorithm fix may have taken two hours without AI assistance; the boilerplate would have taken 90 seconds. Volume metrics do not distinguish between saved time.
3. Ghost seats inflate "active seat" counts. A developer who opens their editor once a week counts as an active Copilot seat — even if they accepted zero suggestions that week. Ghost seat rate (seats licensed but generating no suggestions) is typically 18–28% in enterprise Copilot deployments; this number is not visible in the native dashboard. See how to find and reclaim unused AI coding licences.
4. No link to PR data. Copilot's metrics live in the GitHub admin console, isolated from the repository data also in GitHub. The merge time, PR cycle count, and review feedback on the PR where a suggestion was accepted are not connected to the acceptance event. You would need to build that join yourself.
How do GitHub Copilot native analytics compare to a dedicated AI monitoring platform?
| Capability | GitHub Copilot native analytics | CloudByte PMS |
|---|---|---|
| Seat utilisation (active vs inactive) | ✅ | ✅ |
| Aggregate acceptance rate | ✅ | ✅ |
| Per-developer acceptance data | ⚠️ Enterprise plan only | ✅ |
| Claude Code / multi-tool coverage | ❌ Copilot only | ✅ All tools |
| Cost per developer per week | ❌ Flat seat pricing only | ✅ Token-based cost attribution |
| Accepted suggestion → merged PR correlation | ❌ | ✅ |
| Ghost seat detection | ❌ | ✅ |
| Broken setup / health alerts | ❌ | ✅ |
| Org-wide BYOK key management | ❌ | ✅ |
| Cross-repo git commit analytics | ❌ | ✅ |
The gap is not about Copilot being a bad product. It is about what the Copilot dashboard was designed for — licence management for a single tool — versus what an engineering manager needs for portfolio-level AI investment decisions.
What additional data do engineering managers actually need?
Engineering managers need three data points that Copilot's native analytics does not capture: per-developer output correlation, spend per PR for token-billed tools, and cross-tool adoption rates.
Per-developer output correlation
The question is not "did this developer accept suggestions?" It is "does this developer ship more PRs, or faster PRs, or PRs that pass review in fewer cycles, when they use AI heavily?" That question requires joining AI activity data to git merge data — something Copilot's dashboard does not do, even though both datasets live in GitHub.
Spend per PR for token-billed tools
GitHub Copilot is seat-billed. But engineering teams that use Claude Code (Anthropic token billing) or Cursor Pro (per-request billing) alongside Copilot have real per-PR cost signals that the Copilot dashboard ignores entirely. A team running both tools at scale has no visibility into whether their $19/seat Copilot spend or their $1–$3/PR Claude Code agentic spend is generating more value per dollar. See the full breakdown in how much it costs to merge a PR with Claude Code. For a method that puts both billing models on one comparable footing, see tracking GitHub Copilot vs Claude Code ROI per seat.
Cross-tool adoption rates
Most engineering teams at scale do not use a single AI coding tool. Copilot for IDE completions, Claude Code for agentic tasks, Cursor for certain developers. The Copilot dashboard might show 70% seat utilisation — but if the team is doing their most productive AI work in Claude Code sessions and using Copilot only occasionally, that 70% figure is misleading about where ROI actually comes from. You need combined activity data to know which tool is driving which outcomes.
How do you get cross-tool AI analytics for your engineering team?
A session-level data layer that ingests activity across tools and maps it to git output is the only way to get true cross-tool AI ROI — GitHub's native analytics cannot provide this by design.
The practical setup:
-
For Copilot: Use the GitHub Copilot Metrics API to pull per-developer acceptance data. This requires GitHub Enterprise and Copilot Enterprise ($39/seat/month).
-
For Claude Code: The Anthropic Analytics API gives aggregate daily token counts — not per-developer. You need session-level capture in the developer environment to get per-developer, per-PR data. See how to track LLM API costs across your engineering team.
-
Normalisation: Each tool's data arrives in a different format. A normalisation layer converts acceptance events, token counts, and session data into a common schema keyed on developer identity + repository + timestamp.
-
Git join: The normalised AI activity joins to git log data on the same developer + repository + time window, correlating AI activity to merged PRs, commit frequency, and review cycle length.
CloudByte PMS handles this pipeline automatically for teams using Claude Code — capturing session-level data, normalising it alongside events from other tools, and mapping it to git output so engineering managers see ROI from every AI investment in one place.
FAQ: GitHub Copilot native analytics limitations
What does GitHub Copilot's native analytics dashboard show?
GitHub Copilot's native analytics (GA February 2026) shows active vs inactive seats, aggregate acceptance rates, lines suggested vs accepted, and week-over-week trends. Per-developer breakdowns and API access require GitHub Copilot Enterprise ($39/seat/month).
What are the limitations of GitHub Copilot's native analytics?
Five key gaps: (1) no per-developer cost breakdown, (2) no coverage of other AI tools like Claude Code or Cursor, (3) no correlation of accepted suggestions to merged PRs, (4) no ROI signal connecting AI usage to shipping velocity, and (5) aggregate-only data unless on Enterprise plan.
Can GitHub Copilot analytics track Claude Code usage?
No. Copilot's dashboard only tracks GitHub Copilot activity. Claude Code, Cursor, and other AI tool usage are completely invisible. Teams using multiple AI coding tools need a separate data layer to see combined activity and cross-tool ROI.
What should engineering managers track that Copilot doesn't show?
Three data points: (1) whether developers who use AI heavily actually ship more output — correlated to merged PRs, not just acceptance events; (2) per-PR cost for token-billed tools like Claude Code; (3) cross-tool adoption rates showing which tool each developer uses for productive work.
How do you track AI coding ROI across multiple tools?
You need a session-level capture layer that ingests activity from each AI tool, normalises it to a common schema, and joins it to git output (merged PRs, commit frequency, review cycles). Anthropic's Analytics API gives aggregate totals only; per-developer data requires a session-level agent. CloudByte PMS handles this automatically for Claude Code teams.