AI coding: sprint velocity + bus factor data
After we shared our 30-day data on AI tool adoption, the most common question we got back wasn't from engineering managers. It was from product managers and delivery leads.
"OK, your team uses AI more. Cool. But did you actually ship faster? Did bug rates go up or down? Did your sprint commitments become more reliable?"
Fair questions. And the kind of question that doesn't get answered by a vendor benchmark.
So we pulled four sprints of data — two before AI tool rollout, two after — and looked at what actually changed for delivery outcomes. The results were not what we expected.
This post is the delivery-leader's view of the same 30-day rollout. If you're a PM, eng manager wearing a delivery hat, or VP trying to justify AI tool spend in a roadmap conversation — this one is for you.
TL;DR — what changed in 4 sprints
Across our 22-developer engineering team, before-and-after rollout of AI coding tools (Claude Code), measured over 4 two-week sprints:
| Metric | Baseline (sprints 1–2) | After AI rollout (sprints 3–4) | Change |
|---|---|---|---|
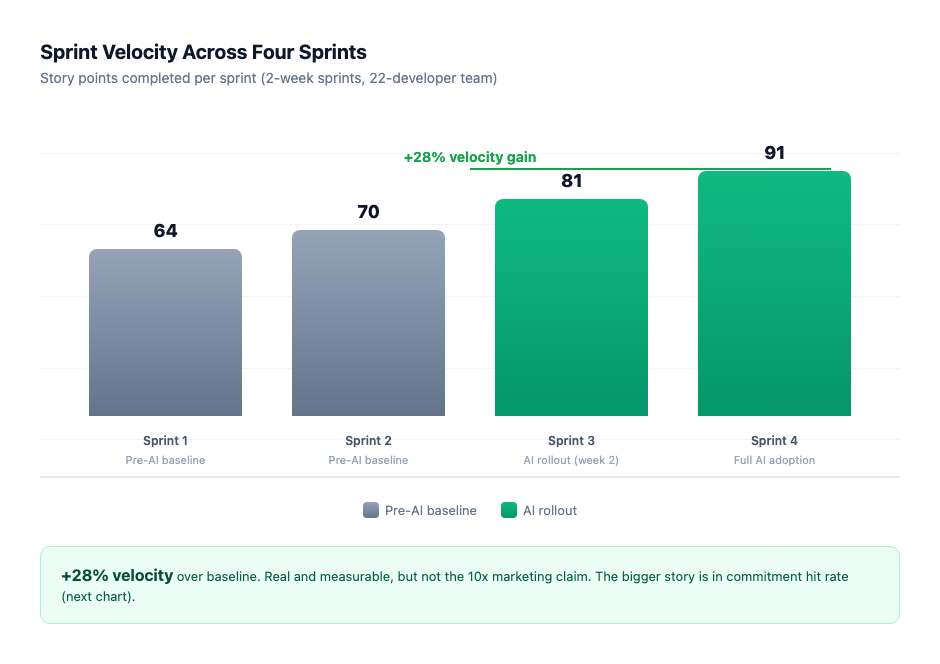
| Sprint velocity (story points completed) | 67 avg | 86 avg | +28% |
| Sprint commitment hit rate | 71% | 89% | +18 pts |
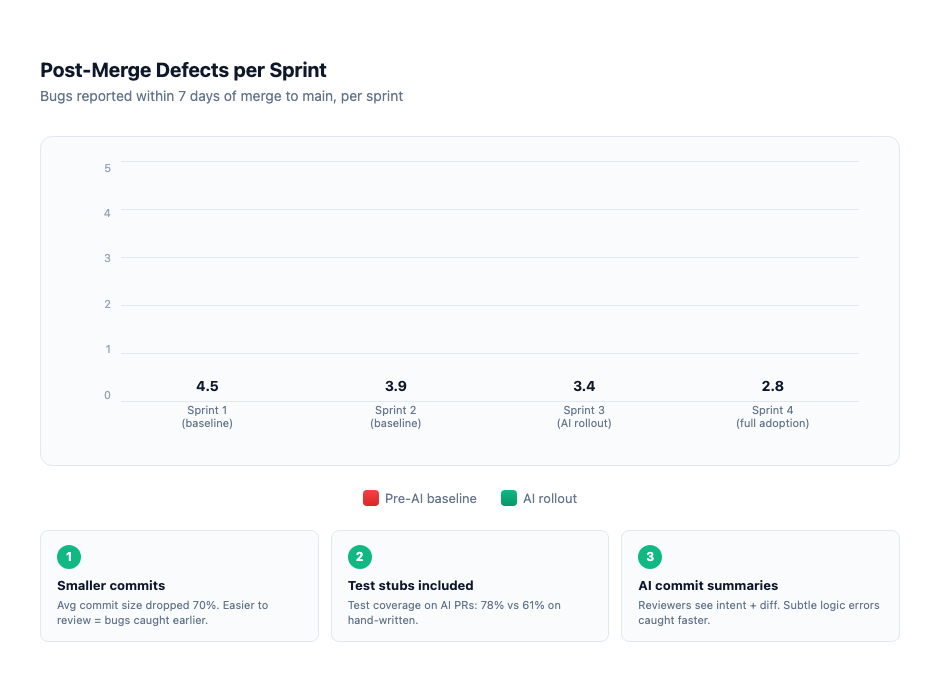
| Bug escape rate (post-merge defects) | 4.2 per sprint | 3.1 per sprint | −26% |
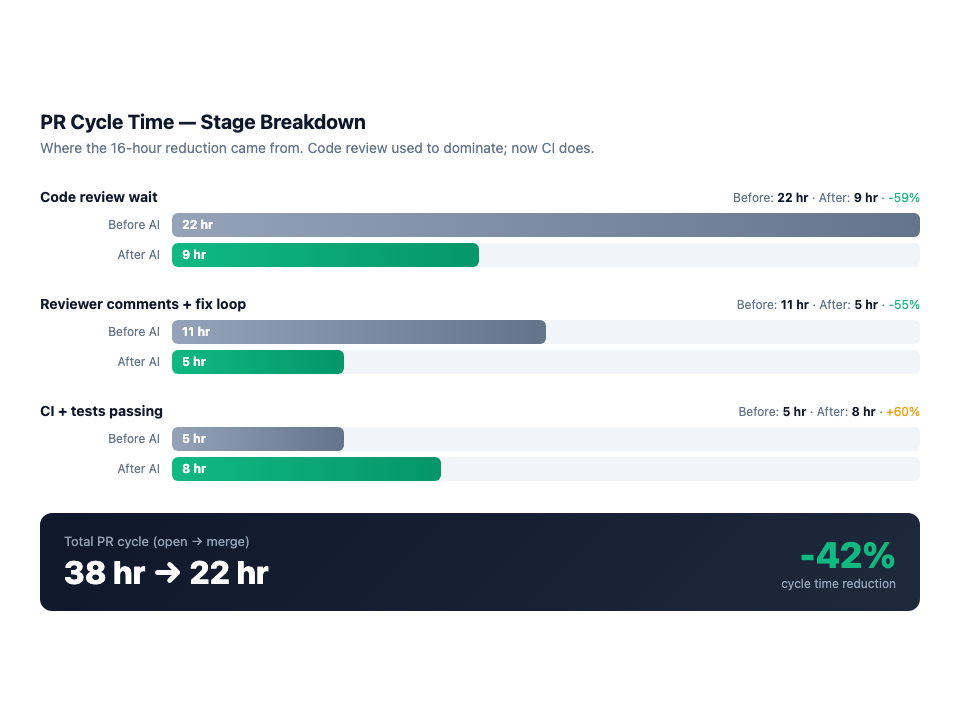
| Avg PR cycle time (open → merge) | 38 hours | 22 hours | −42% |
| Knowledge sharing (cross-dev prompt reuse) | n/a | 34% of prompts shared | New signal |
| Bus factor (top contributor share of commits) | 31% concentrated in 1 dev | 19% in top dev | More distributed |
Not 10x. But every meaningful delivery metric moved in the right direction. And one — the bus factor improvement — was the most strategically important and the one we did NOT predict.
What we measured (and why we trust the numbers)
We tracked four sprints (8 weeks) of delivery data:
- Sprints 1 & 2 (pre-AI baseline): standard team workflow, no AI tools
- Sprints 3 & 4 (post-rollout): Claude Code deployed to all 22 active developers
Data sources: story points + hit rate from our project tracker; bug escape rate from bugs opened within 7 days of merge; PR cycle time from GitHub timestamps; knowledge sharing + bus factor from CloudByte PMS dashboard.
We're not selling a vendor narrative — we're selling a measurement layer. The honest version of these results is what matters.
Finding 1 — Sprint velocity went up, but predictability went up MORE
The headline metric (story points/sprint) increased 28%. That's the easy story to tell.
The more interesting story: commitment hit rate — the percentage of points we committed to in sprint planning that actually got delivered — jumped from 71% to 89%.
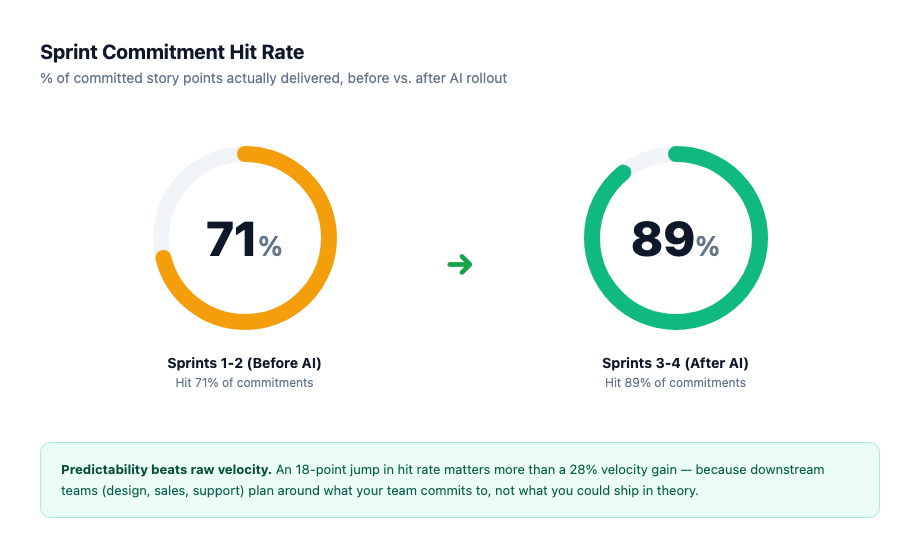
Why does predictability matter more than velocity? Because downstream teams (design, sales, support) plan around what your team commits to, not what you could ship in theory. A team that ships 100 points but only hits 70% of commitments is harder to work with than a team that ships 86 points and hits 89%.
The mechanism: AI assistance reduced uncertainty on individual tickets. Stories that would have taken "1-3 days, depends" became "1.5 days, fairly confident." That confidence aggregated into more predictable sprints.
Finding 2 — Bug rate went DOWN. We did not expect this.
Conventional wisdom: "AI generates plausible-looking but subtly wrong code, so bug rates go up." We were ready for that.
The data said the opposite. Post-merge defects dropped 26% (from 4.2 to 3.1 per sprint).
Why? Three contributing factors we identified:
- AI commits are smaller and more focused. Average commit size dropped 70%. Smaller commits = easier review = bugs caught earlier.
- AI naturally writes test stubs. Developers prompting for a function often got a function + a test scaffold in the same response. Test coverage on AI-assisted PRs averaged 78% vs 61% on hand-written PRs.
- AI commit summaries surface intent. Our reviewers had a one-paragraph summary of what each commit was trying to do, alongside the diff. That made it harder to miss subtle logic errors.
This isn't a universal effect. Bug rate went UP on infrastructure/Terraform changes (small sample, but consistent direction). AI confidently generates plausible-looking infra code that breaks at apply time. Use AI for it cautiously.
Finding 3 — PR cycle time dropped 42%
This was the metric that PMs cared about most when we shared the data.
Open-to-merge time dropped from 38 hours to 22 hours. That's not the AI generating code faster — code generation was always fast. It's everything around the PR getting faster:
- AI-generated commit summaries → reviewers understand intent in seconds
- Smaller commits → reviewers approve faster, more confidently
- Test stubs included → CI passes on first try more often
- "Improve with AI" suggestions on review comments → roundtrips shorter
The compounding effect: faster cycle time meant more PRs in flight at once meant more parallel work shipped per sprint. This is why velocity went up even when individual coding speed didn't change as much as the marketing suggested.
Finding 4 — How AI coding reduces developer bus factor
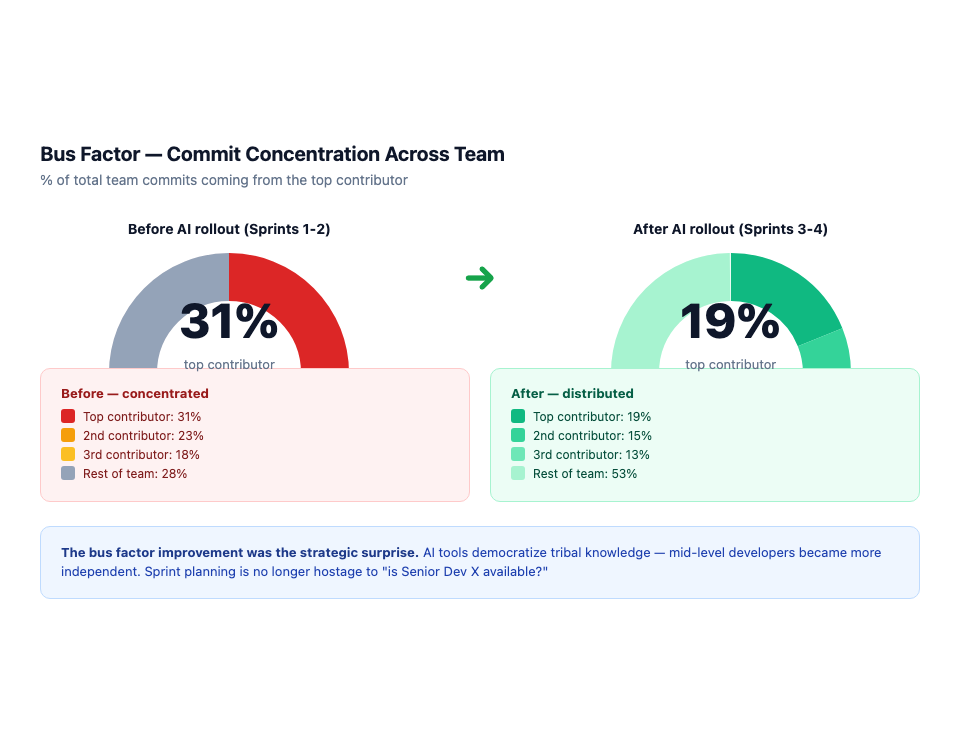
AI coding tools reduce developer bus factor by giving every developer on-demand access to tribal knowledge that was previously locked in senior contributors. Our 22-developer team saw top-contributor commit concentration drop from 31% to 19% over four sprints — without any deliberate redistribution effort. Mid-level developers stopped waiting for the senior dev and started asking Claude Code instead.
This one matters more than it looks.
Before AI rollout, 31% of our team's commits came from a single power developer. If that person was sick, on leave, or distracted, sprint output dropped noticeably. Classic bus-factor risk.
After 4 sprints with AI tools, that concentration dropped to 19%. The mechanism: mid-level developers became more independent. They didn't need to ping the senior dev for "how do I…" questions as often — Claude Code answered first.
For a delivery leader, this is huge. It means:
- Sprint planning is less dependent on "is Senior Dev X available?"
- Mid-level developers are unblocked faster (less waiting on senior review for unfamiliar areas)
- Onboarding new developers is faster (AI is the always-available pair programmer)
We didn't plan for this. It emerged because AI assistance changed the team's information topology — not just its coding speed.
Finding 5 — Knowledge sharing emerged from prompt reuse
We did NOT track this in sprint 1. We started tracking in sprint 3 because we noticed a pattern in the dashboard: developers were discovering and reusing each other's effective prompts.
By sprint 4, 34% of all prompts were variants of prompts another developer had written first. We measured this via prompt similarity scoring in CloudByte PMS.
This created an unexpected secondary benefit: a kind of organic playbook for "how to work with the codebase." When a developer figured out a good prompt for "generate a CRUD endpoint following our conventions," that prompt spread across the team within days.
We've since formalised this with our Skills Library — admin-curated prompts that sync to every developer's tool. But the organic version emerged before we built it.
What we'd tell a PM evaluating AI tool ROI
If you're a delivery lead deciding whether to renew (or cut) AI tool licenses, our data suggests:
- Velocity is the wrong primary metric. It moved 28% — meaningful but not transformative. Predictability moved more (18 pts) and matters more for planning conversations.
- Bug rate is a tell. If your team's bug rate goes UP after AI rollout, your AI is being used on the wrong projects (likely infra/legacy). Move it to greenfield work and infrastructure team usage will self-correct.
- Bus factor improvement is the strategic win. Most ROI conversations focus on speed. The actual leverage is removing key-person dependencies. That's worth more than a 28% velocity gain over 12 months.
- PR cycle time tells you if the rollout is "real." If cycle time doesn't drop after AI rollout, your team isn't actually using AI for the things that compound (commits, summaries, test stubs). They're just using it for autocomplete. Different game.
- You can't measure any of this without instrumentation. None of these numbers came from the AI tool itself. They came from a dashboard layered on top.
Was the sprint velocity improvement worth the LLM API cost?
Yes — but only if you're tracking cost per output unit, not just raw API spend.
Our 28% velocity improvement (67 → 86 story points per sprint) came with a real increase in LLM API costs: median spend per active developer ran $22–$38/month on Sonnet-class models. For a 22-developer team, that's roughly $500–$830/month in additional API costs beyond any seat subscriptions.
Against a baseline of ~67 story points/sprint and median developer salary around $160k/year, a 28% velocity gain is equivalent to adding 6 developer-sprints of output per year without adding headcount. The cost-to-output ratio was strongly positive — but we only knew that because we tracked API spend alongside delivery metrics.
Most teams either watch the velocity gains without tracking the cost, or watch the API bill without tracking what it produced. The number that matters is cost per story point delivered — and for us it dropped 18% after AI rollout, because output grew faster than costs.
If you want to apply the same analysis to your team, the starting point is getting per-developer LLM cost visibility alongside your delivery data. The guide to tracking LLM API costs across your engineering team covers how to attribute API spend by developer and project so you can run the same cost-per-output calculation. For the full ROI formula with worked examples and a comparison table across tool types, see how to calculate AI coding ROI for engineering teams.
Want to see what your team's sprint velocity vs AI activity looks like?